Top 3 Price Prediction Bitcoin, Ethereum, Ripple: BTC declines as resistance emerges near all-time high
- Bitcoin is declining and nearing its key support level of $69,500; a sustained close below this mark could trigger further declines.
- Ethereum is approaching its ascending trendline support; a close below could signal a possible downturn.
- Ripple price is nearing the $0.488 level; a firm close below would suggest a continuation of its downtrend.

Bitcoin (BTC) and Ethereum (ETH) are approaching their key support levels, and a sustained close below these marks could lead to further declines. Similarly, Ripple (XRP) is nearing its critical support level, where a firm close below would indicate a continuation of its downtrend.
Bitcoin declines as it faces resistance around its all-time high
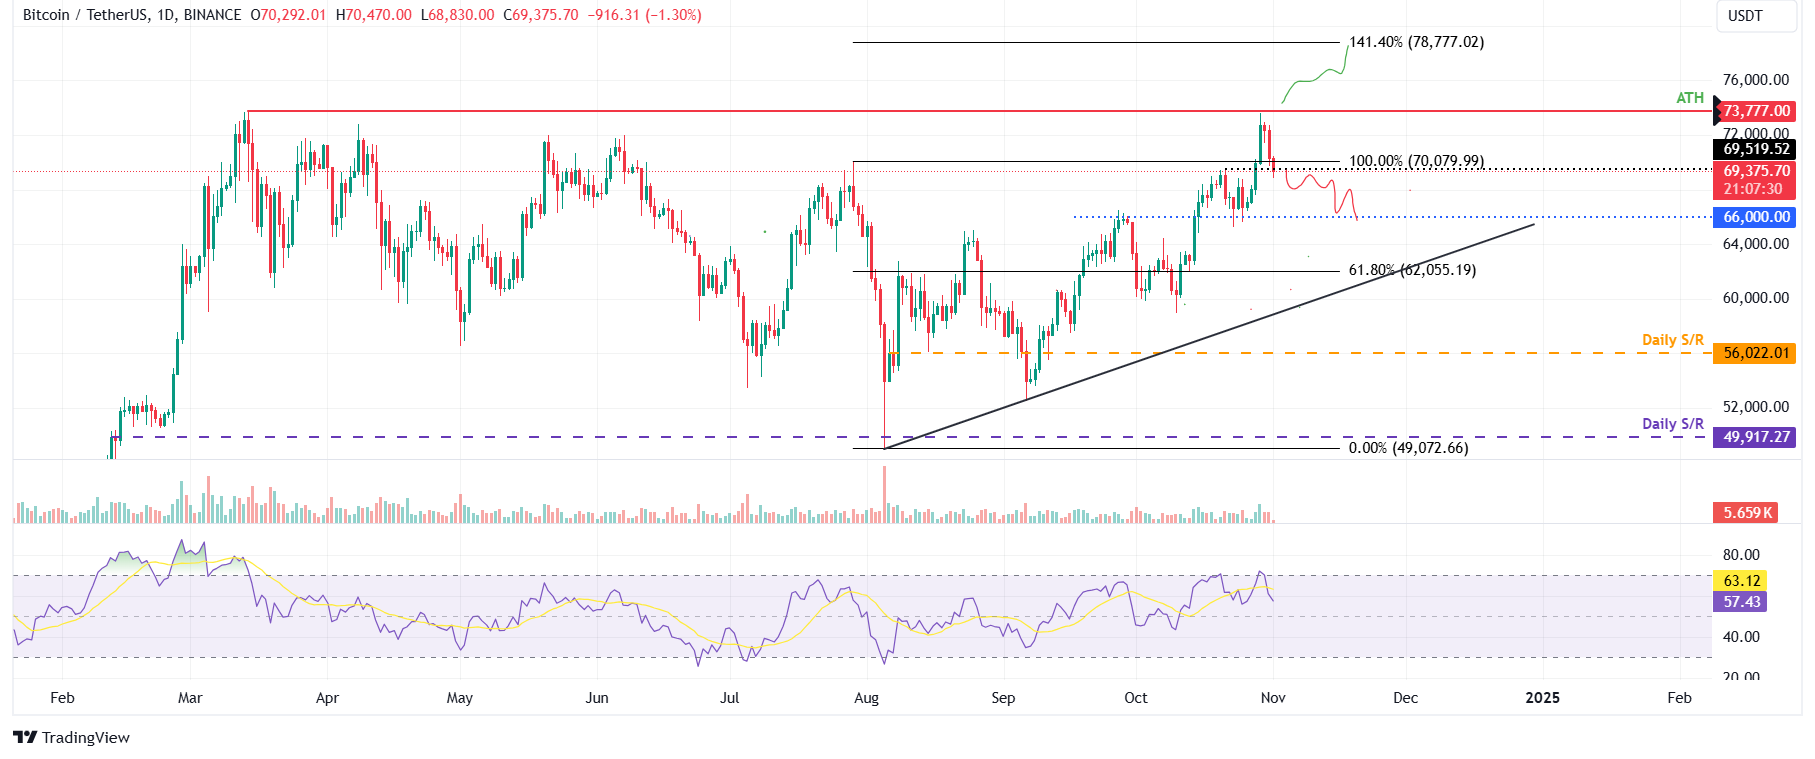
Bitcoin price faced resistance around its all-time high (ATH) level of $73,777, seen in mid-March, on Tuesday and declined 3.2% in the next two days. At the time of writing on Friday, it continues to decline and trades around $69,400.
If BTC continues its decline and closes below the $69,500 level, it could extend its decline by over 5% to retest its next key support level at $66,000.
The Relative Strength Index (RSI) on the daily chart, which peaked at an overbought level of 70 on Tuesday, has since dropped sharply to 57, signaling a significant weakening in bullish momentum.
BTC/USDT daily chart
However, if Bitcoin holds above the $69,500 level, it may reattempt to retest and break through its all-time high of $73,777.
Ethereum is poised for a downturn if it closes below the key support level
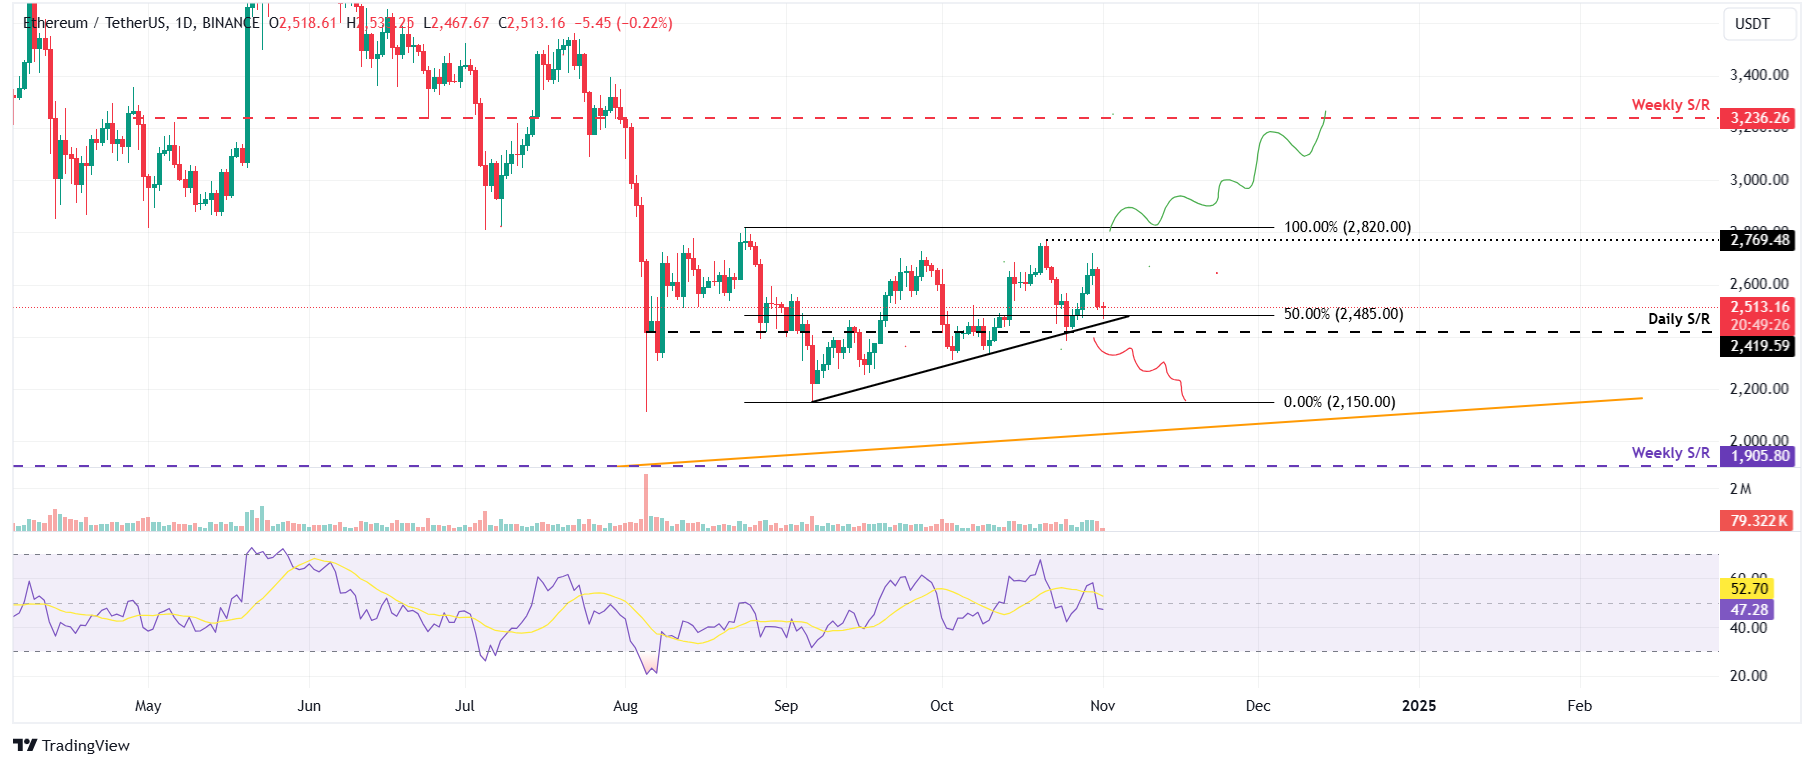
Ethereum's price is nearing its crucial support level of around $2,450 on Friday after declining over 5.4% on Thursday. This level is important as it roughly coincides with the 50% price retracement level at $2,485, the ascending trendline (drawn from joining multiple low levels with a trendline since early September) and the daily support at $2,419.
If ETH breaks below the ascending trendline and closes below the $2,419 support level, it could extend the decline by 11% to retest its September 6 low of $2,150.
The RSI on the daily chart reads at 47, below its neutral level of 50, indicating increasing bearish momentum.
ETH/USDT daily chart
On the other hand, if the ascending trendline holds as support, ETH could rally to its current level and retest its October 21 high of $2,769.
Ripple price shows signs of weakness
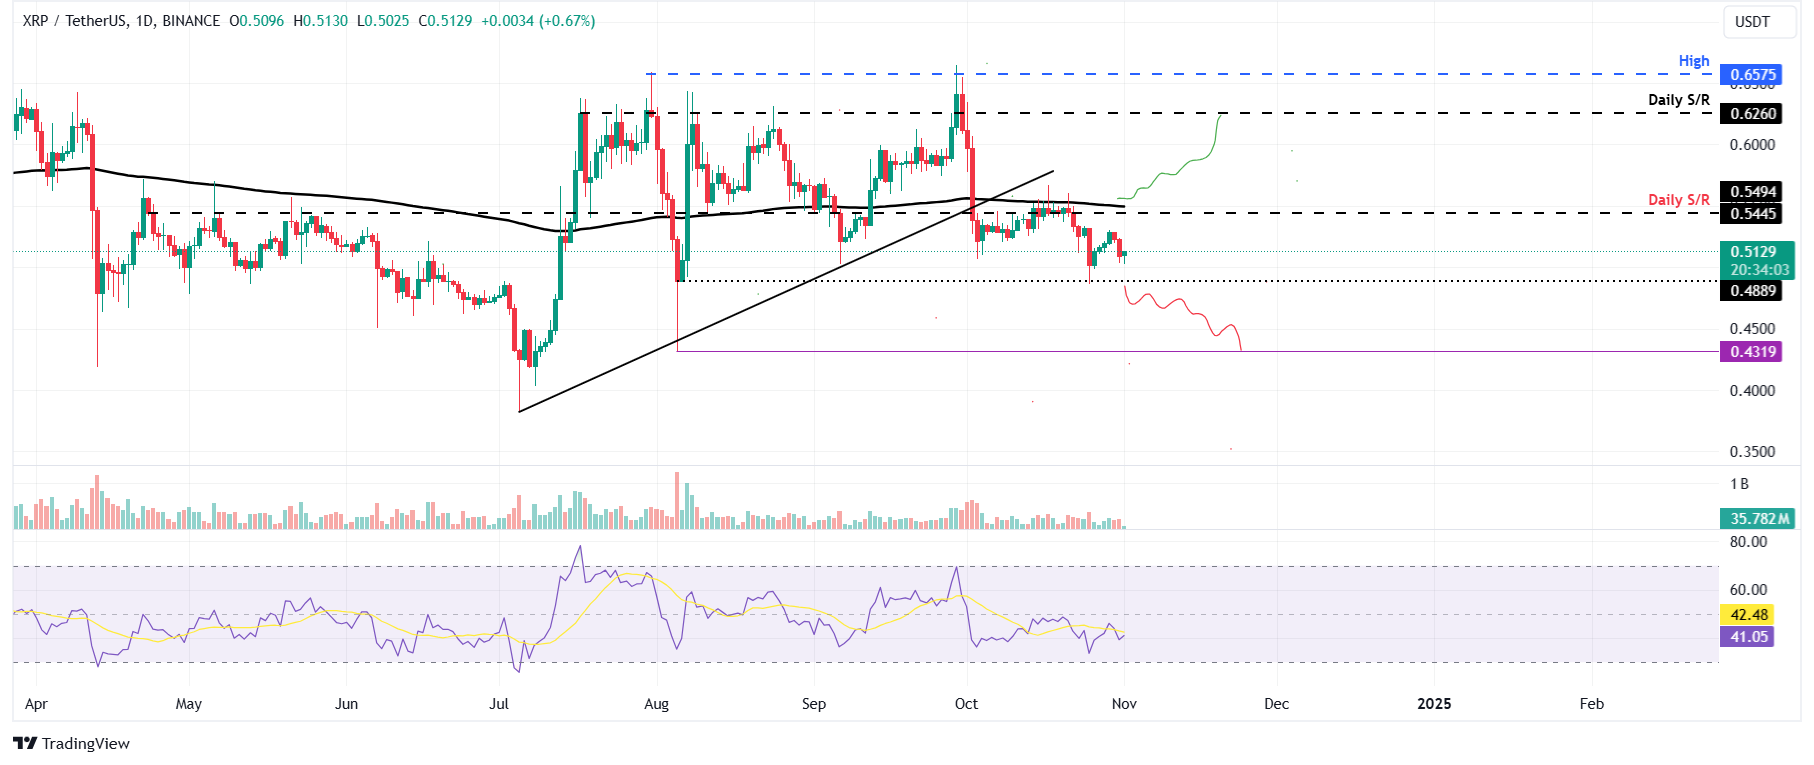
Ripple price faced resistance around the daily resistance level of $0.544 on Tuesday and declined 3.5% until Thursday. At the time of writing on Friday, it trades slightly higher, around $0.512.
If XRP declines and closes below $0.488, it could extend the decline by 12% to retest its August 5 low of $0.431.
The RSI indicator on the daily chart is at 41, below its neutral level of 50, suggesting that bearish momentum is gaining traction.
XRP/USDT daily chart
If XRP breaks and closes above the 200-day EMA at $0.549, it could extend the rally by 13% and retest its next daily resistance level at $0.626.
Bitcoin, altcoins, stablecoins FAQs
Bitcoin is the largest cryptocurrency by market capitalization, a virtual currency designed to serve as money. This form of payment cannot be controlled by any one person, group, or entity, which eliminates the need for third-party participation during financial transactions.
Altcoins are any cryptocurrency apart from Bitcoin, but some also regard Ethereum as a non-altcoin because it is from these two cryptocurrencies that forking happens. If this is true, then Litecoin is the first altcoin, forked from the Bitcoin protocol and, therefore, an “improved” version of it.
Stablecoins are cryptocurrencies designed to have a stable price, with their value backed by a reserve of the asset it represents. To achieve this, the value of any one stablecoin is pegged to a commodity or financial instrument, such as the US Dollar (USD), with its supply regulated by an algorithm or demand. The main goal of stablecoins is to provide an on/off-ramp for investors willing to trade and invest in cryptocurrencies. Stablecoins also allow investors to store value since cryptocurrencies, in general, are subject to volatility.
Bitcoin dominance is the ratio of Bitcoin's market capitalization to the total market capitalization of all cryptocurrencies combined. It provides a clear picture of Bitcoin’s interest among investors. A high BTC dominance typically happens before and during a bull run, in which investors resort to investing in relatively stable and high market capitalization cryptocurrency like Bitcoin. A drop in BTC dominance usually means that investors are moving their capital and/or profits to altcoins in a quest for higher returns, which usually triggers an explosion of altcoin rallies.
Author

Manish Chhetri
FXStreet
Manish Chhetri is a crypto specialist with over four years of experience in the cryptocurrency industry.



