Bitcoin's on-chain transfers is a leading indicator for corrections and it is currently hitting critical levels
- Bitcoin percentage of transfer volume in profit, an on-chain metric, hints at Bitcoin's significant correction.
- BTC/USD could revisit the support at $16,500 if the price slides under the 100 SMA on the 4-hour chart.

Bitcoin price closed in on $20,000 but stalled at $19,915 on Tuesday, the highest Bitcoin has ever traded in history. However, the flagship cryptocurrency is in the middle of a retreat as on-chain metrics such as Glassnode's percentage of transfer volume in profit turn strongly bearish. BTC's rally seems to have hit a tipping point as declines beckon profusely.
Understanding Bitcoin's percentage of transfer volume in profit metric
Glassnode has a myriad of on-chain indicators that are useful to all investors, be it individual or institutional. As discussed on Tuesday, the Net Unrealized Profit/Loss on-chain metric suggested that Bitcoin is yet to hit the ultimate new all-time high in the current bull run.
Bitcoin later reacted by extending the upswing much closer to $20,000 but left the crucial level untouched. Meanwhile, as the price retreats toward $18,000, the percentage of transfer volume in profit metric hints at a significant correction.
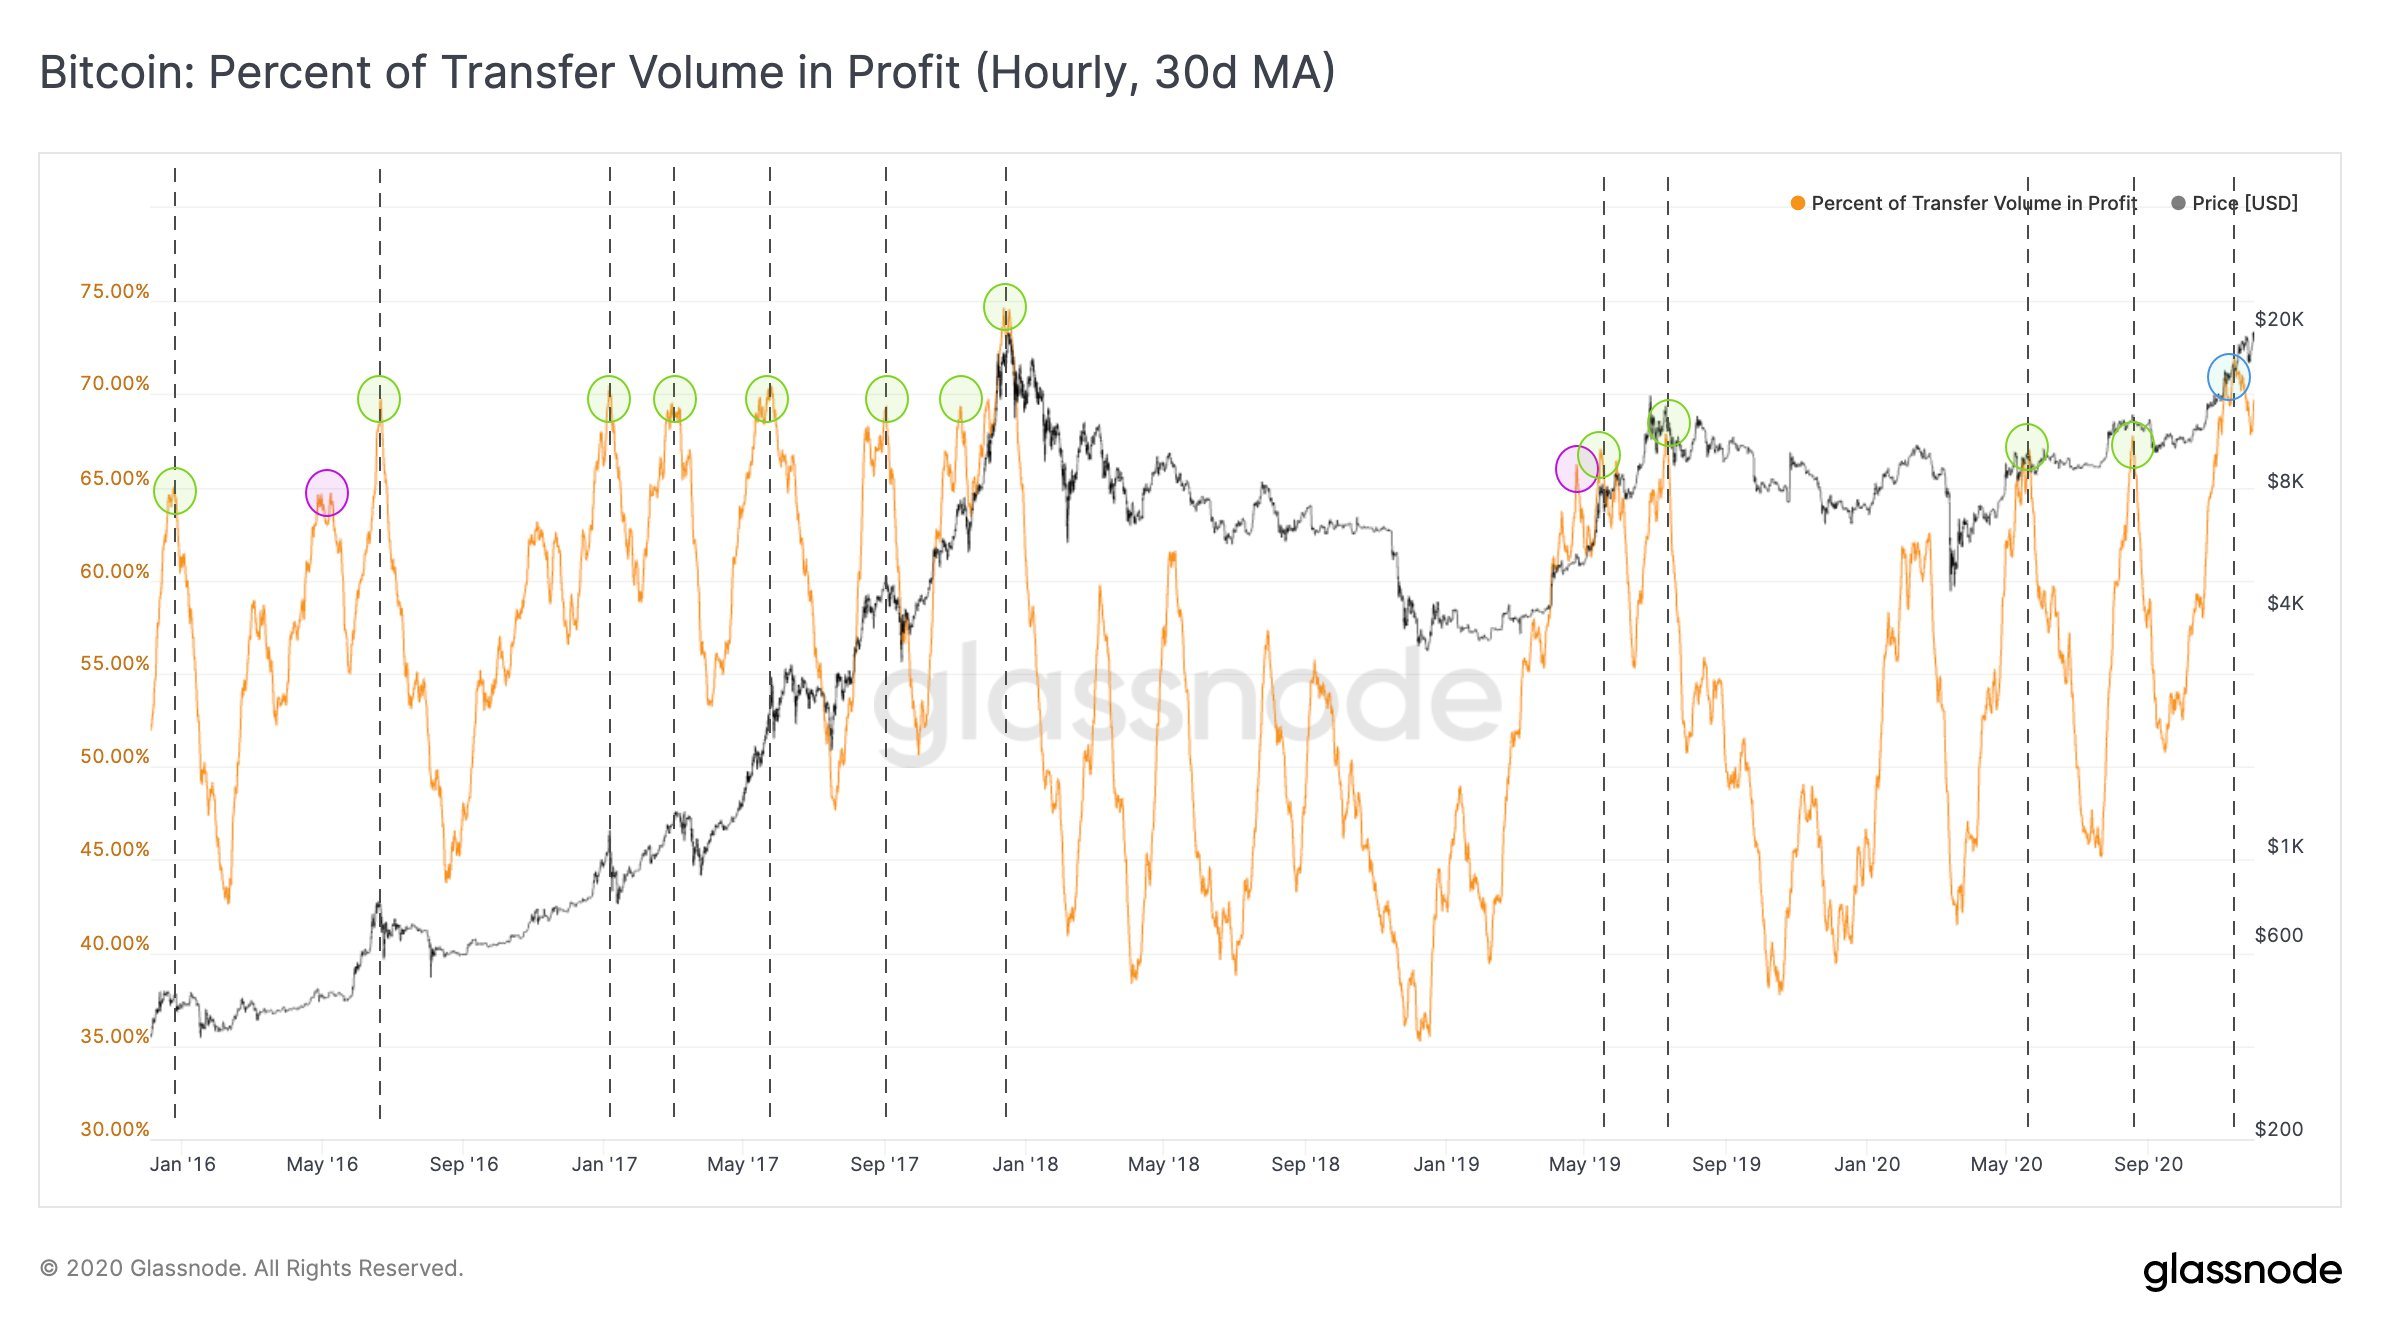
According to Glassnode, the percentage of transfer volume in profit refers to the "percentage of transferred coins whose price at the time of their previous movement was lower than the current price." The indicator does not consider all the outputs that carry a lifespan of less than an hour. In other words, this on-chain metric tracks the amount of Bitcoin moved within the chain and is profitable.
-637424821479621558.png)
Bitcoin percentage of transfer volume in profit chart
The percentage of transfer volume in profit can identify local tops when trading in bull markets. For instance, movement above 65% suggests that Bitcoin is reaching a tipping point and a correction seems imminent.
The indicator is holding above 70%, the highest level it has reached since January 2018. Bitcoin embarked on a long-term downtrend in 2018, reaching a yearly low of around $3,100. A similar pattern is likely to occur as far as history is concerned.
Bitcoin percentage of transfer volume in profit chart
According to CoinMetrics, Bitcoin's on-chain supply activity suggests that volatility has increased significantly as investors move previously dormant coins. The BTC moved is likely being sold as investors cash out profits, but some coins are moved from one address to another or from one exchange to the other.
"About 873K BTC were active within the past week (about 5% of total supply), while about 14.47M BTC have been active within the last five years (about 78% of total supply)."
Currently, the "1-year active supply percent" of total BTC supply is at 38.4%. The metric has shot up from the 36.5% low in September. In conjunction with Glassnode's Bitcoin percentage of transfer volume in profit, it shows selling pressure is most likely soar as investors hit attractive profit levels, validating the bearish outlook.
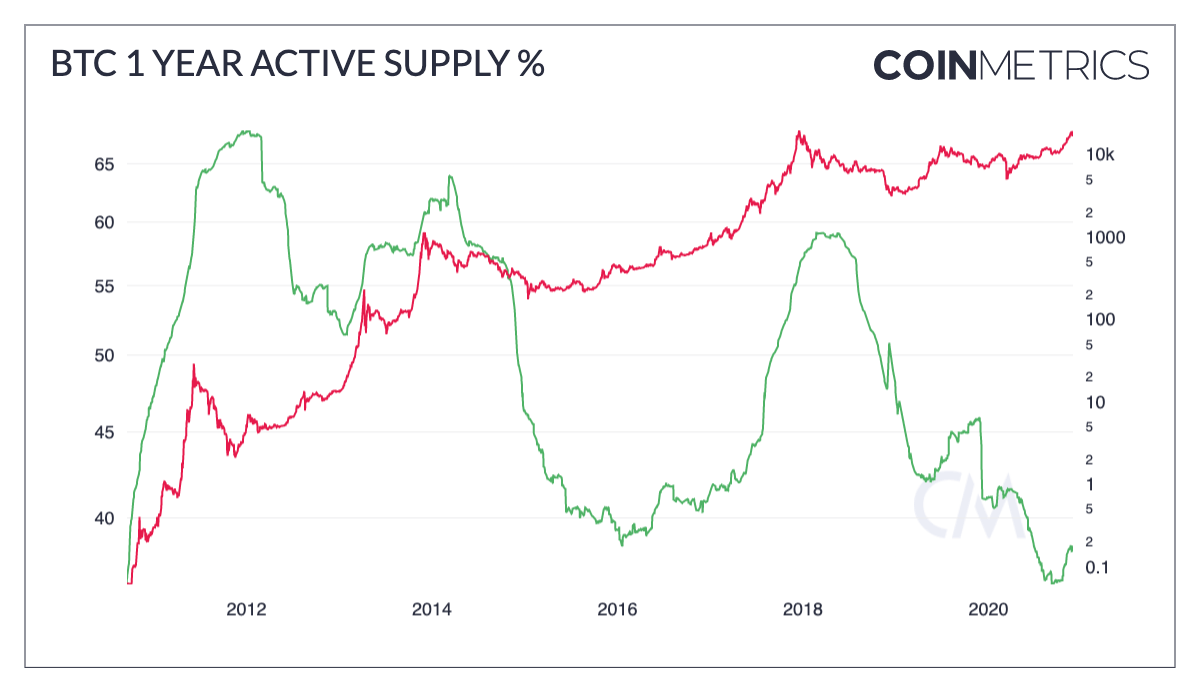
Bitcoin one-year active supply percent chart
The TD Sequential indicator recently presented a sell signal on the 4-hour chart. The call to sell manifested in a green nine candlestick and preceded the ongoing correction. If selling activities surge, Bitcoin could embark on an extended freefall.
Bitcoin is trading slightly below $18,400 while seeking support at the 50 Simple Moving Average. Closing the day under this level might force BTC below $18,000 (100 SMA). Extended losses are likely to revisit the 200 SMA near $16,500.
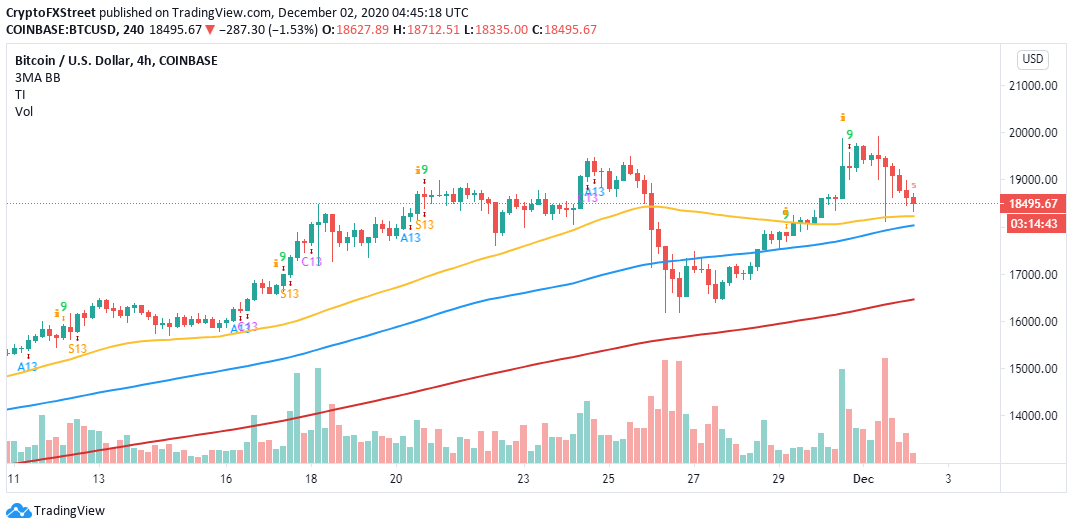
BTC/USD 4-hour chart
Bitcoin will resume the uptrend if it makes a daily close above the 50 SMA. Moreover, the TD Sequential indicator could present a buy signal in the coming days and call for more buyers to join the market. Trading above $19,000 could elevate Bitcoin to new all-time highs above $20,000.
Author

John Isige
FXStreet
John Isige is a seasoned cryptocurrency journalist and markets analyst committed to delivering high-quality, actionable insights tailored to traders, investors, and crypto enthusiasts. He enjoys deep dives into emerging Web3 tren


