Bitcoin Weekly Forecast: Will the “Uptober” rally reach a fresh all-time high?
- Bitcoin continues to climb this week after breaking its resistance barrier, aiming for a new all-time high.
- US spot Bitcoin ETFs posted $1.86 billion in inflows until Thursday, the largest streak of inflows since mid-July.
- BTC’s performance since the fourth halving closely resembles that of the third halving, when prices increased sharply.

Bitcoin (BTC) rallied nearly 8% so far this week until Friday after breaking its resistance barrier, aiming for a fresh all-time high (ATH). This rise in Bitcoin’s price is supported by an increase in institutional demand, which showcased a $1.86 billion inflows this week, the largest streak of inflows since mid-July. Rising apparent demand and institutional reports suggest that the current BTC cycle resembles the third halving, when prices increased sharply.
Bitcoin sees a rise in institutional demand
Institutional demand supported Bitcoin’s price this week. According to Coinglass data, the US spot Bitcoin Exchange Traded Funds (ETFs) recorded four straight inflows this week until Thursday, totaling $1.86 billion in net inflows. This increase in inflows suggests that institutional investors’ demand for Bitcoin is rising.
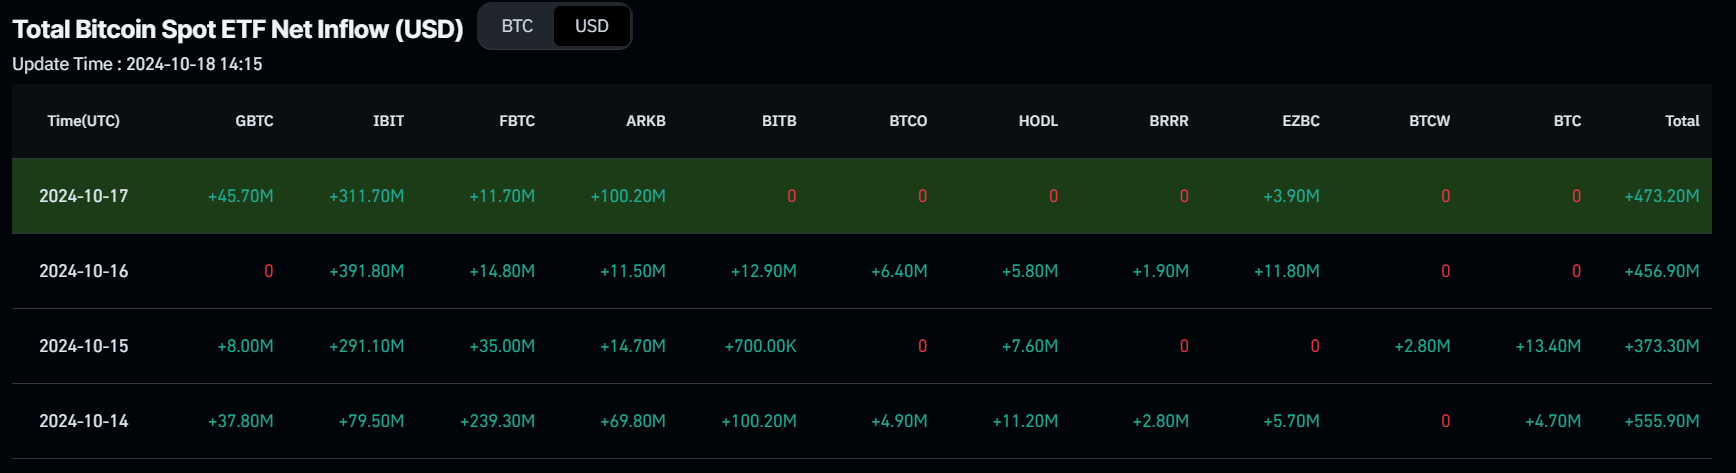
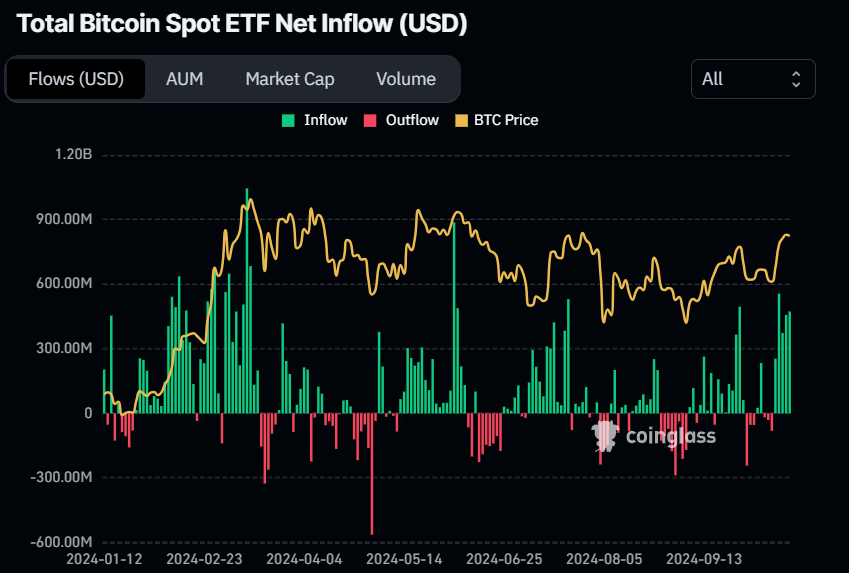
Total Bitcoin Spot ETF Net Inflow chart. Source: Coinglass
Diving deep into the rising demand thesis for Bitcoin, the Cryptoquant weekly report gives a clearer picture. The report points to a resurgence in Bitcoin demand, with current apparent demand reaching 177,000 BTC. As shown in the graph below, this has historically preceded significant price rallies to new record highs in 2020-2021 and 2024, suggesting that a further increase in demand is essential for a sustainable move toward new all-time highs.
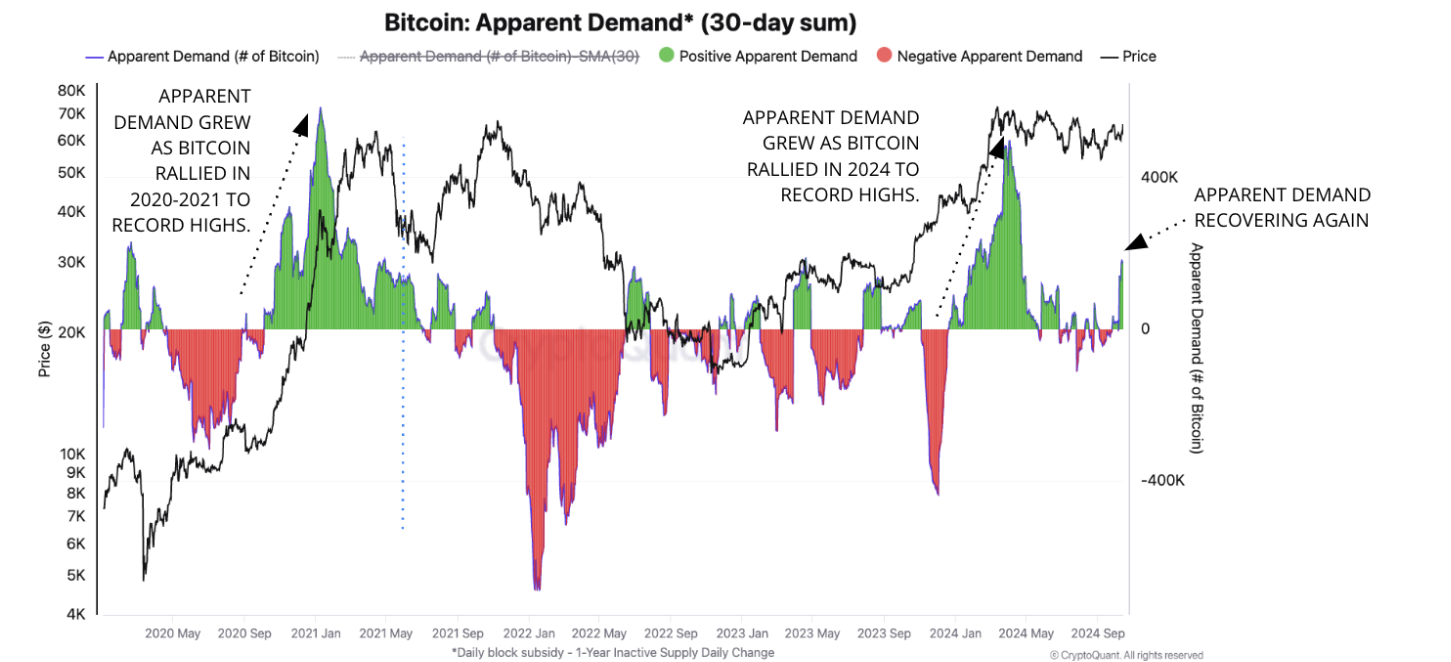
Bitcoin Apparent demand chart. Source: CryptoQuant
Moreover, another report from Coinbase Institutional explains that BTC’s performance since the fourth halving most closely resembles the performance seen after the third halving, when prices went sideways for several months before moving sharply higher within a year of the event.
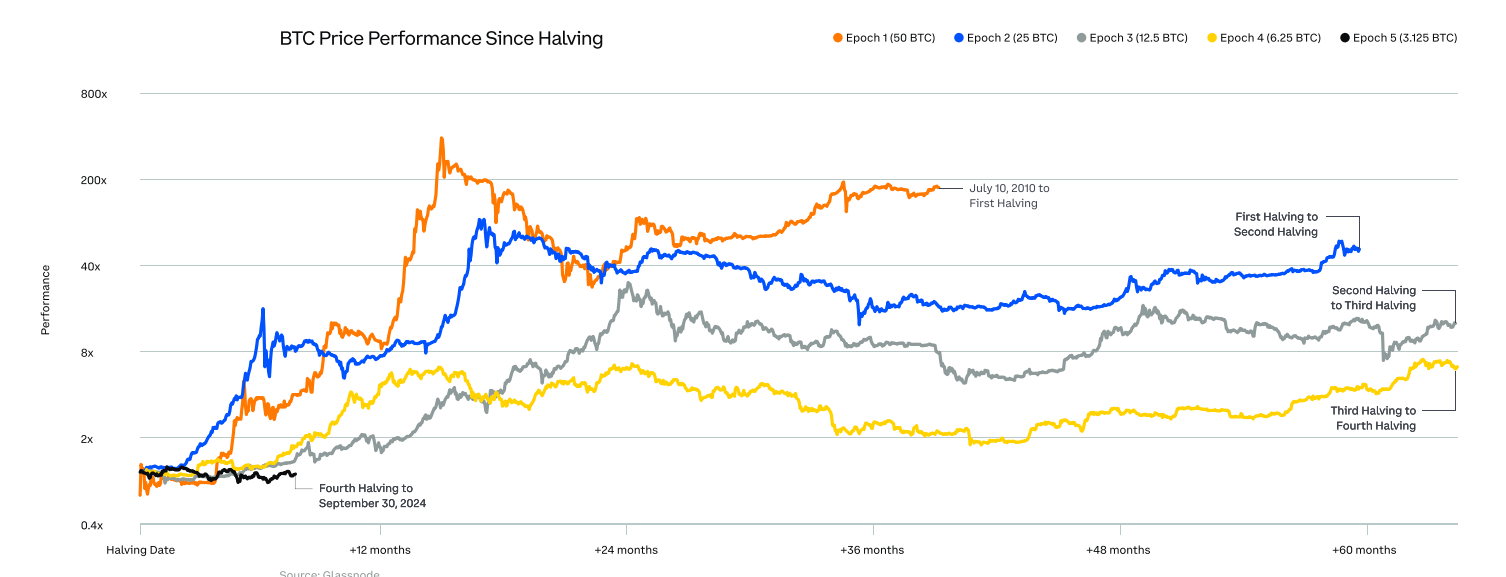
Bitcoin Price Performance Chart. Source: Glassnode
Despite the on-chain metrics and reports suggesting a rise in demand for Bitcoin, traders should be cautious and keep a watch on Tesla’s recent funds transfer. According to Arkham Intelligence data, Tesla moved $760 million worth of Bitcoin into other wallets this week. This transfer of funds is still unclear if it’s internal shuffling or selling.
TESLA JUST MOVED ANOTHER $260M BTC
— Arkham (@ArkhamIntel) October 15, 2024
TOTAL MOVED: $760M pic.twitter.com/ukAcHW1EZC
“Even if they sold, the impact would be slightly more than half of the German government’s. Their realized profit was $816 million, while Tesla’s is $515 million as of today,” said Ki Young Ju, founder and CEO of CryptoQuant, in a Twitter post.
Bitcoin technical outlook: Targets ATH of $73,777
Bitcoin’s weekly chart shows that the biggest crypto asset by market capitalization is breaking above the downward-slopping parallel channel pattern. This pattern is formed by connecting multiple weekly closes with two trendlines (from early March to October); a breakout of this pattern (confirmed by a weekly close above the upper boundary line) favors the bulls.
The pattern’s technical target (obtained by measuring the distance between the two trendlines) projects a new ATH of $78,955.
The Relative Strength Index (RSI) momentum indicator on the weekly chart trades at 58, above its neutral level of 50 and still far below overbought conditions, suggesting bullish momentum is gaining traction.
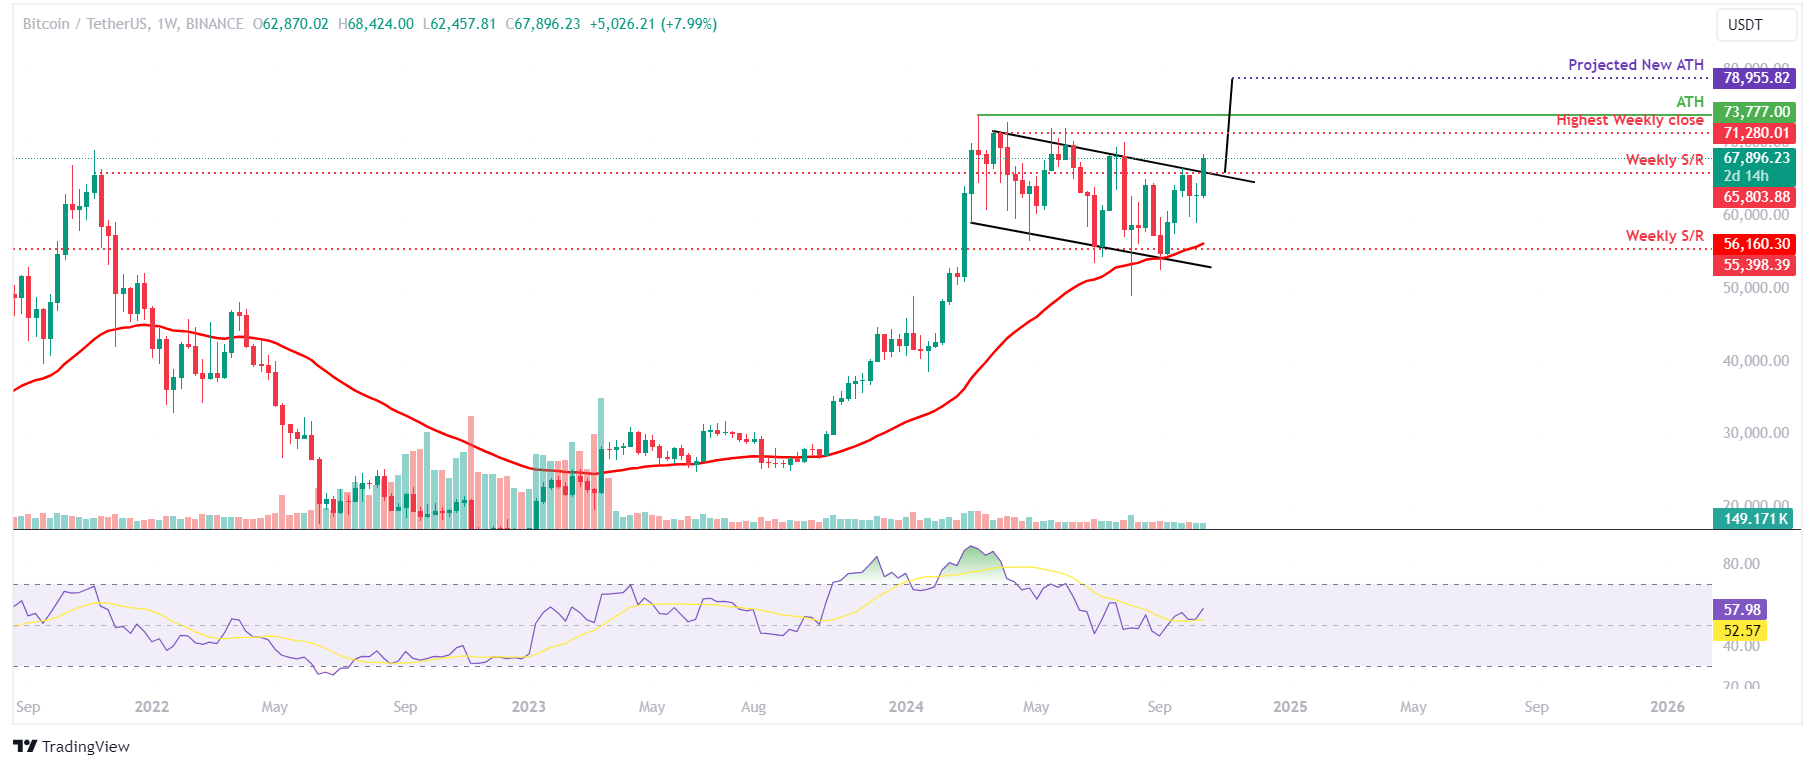
BTC/USDT weekly chart
The daily chart also shows signs of strength after it broke and closed above the $66,000 resistance level on Tuesday. At the time of writing on Friday, it continues to edge higher, trading around $67,900.
If the $66,000 level holds as support, BTC will continue its ongoing rally to retest its July 29 high of $70,079. With a successful close above $70,079, BTC aims for its next target at the current ATH of $73,777.
The RSI indicator on the daily chart is trading at 68, nearing its overbought level of 70. If it enters the zone on a closing basis, traders will be advised not to add to their long positions because the chances of a pullback would increase. Another possibility, however, is that the rally continues, and the RSI stays in the overbought zone.
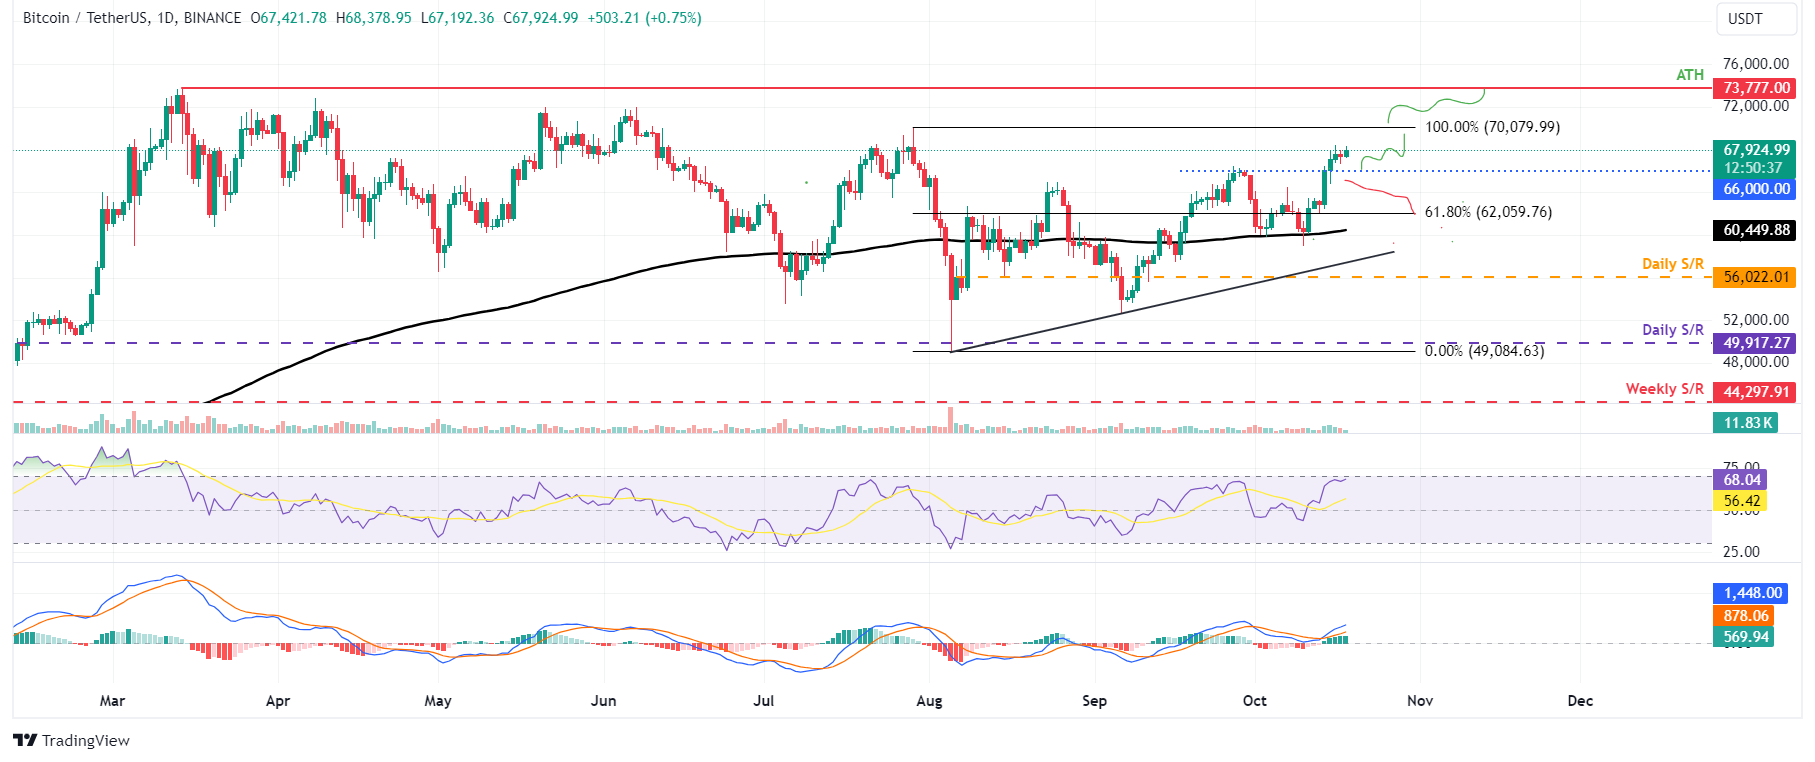
BTC/USDT daily chart
Bitcoin, altcoins, stablecoins FAQs
Bitcoin is the largest cryptocurrency by market capitalization, a virtual currency designed to serve as money. This form of payment cannot be controlled by any one person, group, or entity, which eliminates the need for third-party participation during financial transactions.
Altcoins are any cryptocurrency apart from Bitcoin, but some also regard Ethereum as a non-altcoin because it is from these two cryptocurrencies that forking happens. If this is true, then Litecoin is the first altcoin, forked from the Bitcoin protocol and, therefore, an “improved” version of it.
Stablecoins are cryptocurrencies designed to have a stable price, with their value backed by a reserve of the asset it represents. To achieve this, the value of any one stablecoin is pegged to a commodity or financial instrument, such as the US Dollar (USD), with its supply regulated by an algorithm or demand. The main goal of stablecoins is to provide an on/off-ramp for investors willing to trade and invest in cryptocurrencies. Stablecoins also allow investors to store value since cryptocurrencies, in general, are subject to volatility.
Bitcoin dominance is the ratio of Bitcoin's market capitalization to the total market capitalization of all cryptocurrencies combined. It provides a clear picture of Bitcoin’s interest among investors. A high BTC dominance typically happens before and during a bull run, in which investors resort to investing in relatively stable and high market capitalization cryptocurrency like Bitcoin. A drop in BTC dominance usually means that investors are moving their capital and/or profits to altcoins in a quest for higher returns, which usually triggers an explosion of altcoin rallies.
Author

Manish Chhetri
FXStreet
Manish Chhetri is a crypto specialist with over four years of experience in the cryptocurrency industry.




