Bitcoin Weekly Forecast: Should you trust this BTC sell signal or wait for $34,000?
- Bitcoin price eyes a retest of $34,485 as it trends higher after a breakout from a multi-year falling wedge.
- Although there is a sell sign developing on the higher timeframe, investors need to wait for more confirmation.
- The bears are likely to gain control if BTC loses the $19,600 level and sets up another lower low.

Bitcoin price shows a clear picture of its rally after it breached a long-term bullish pattern in mid-January. As the rally takes a breather, sell signs have started to emerge, which is putting investors in a confused state.
Also read: Bitcoin Weekly Forecast: Assessing likelihood of 80% rally for BTC before 2023
Bitcoin price envisions its last leg of the rally
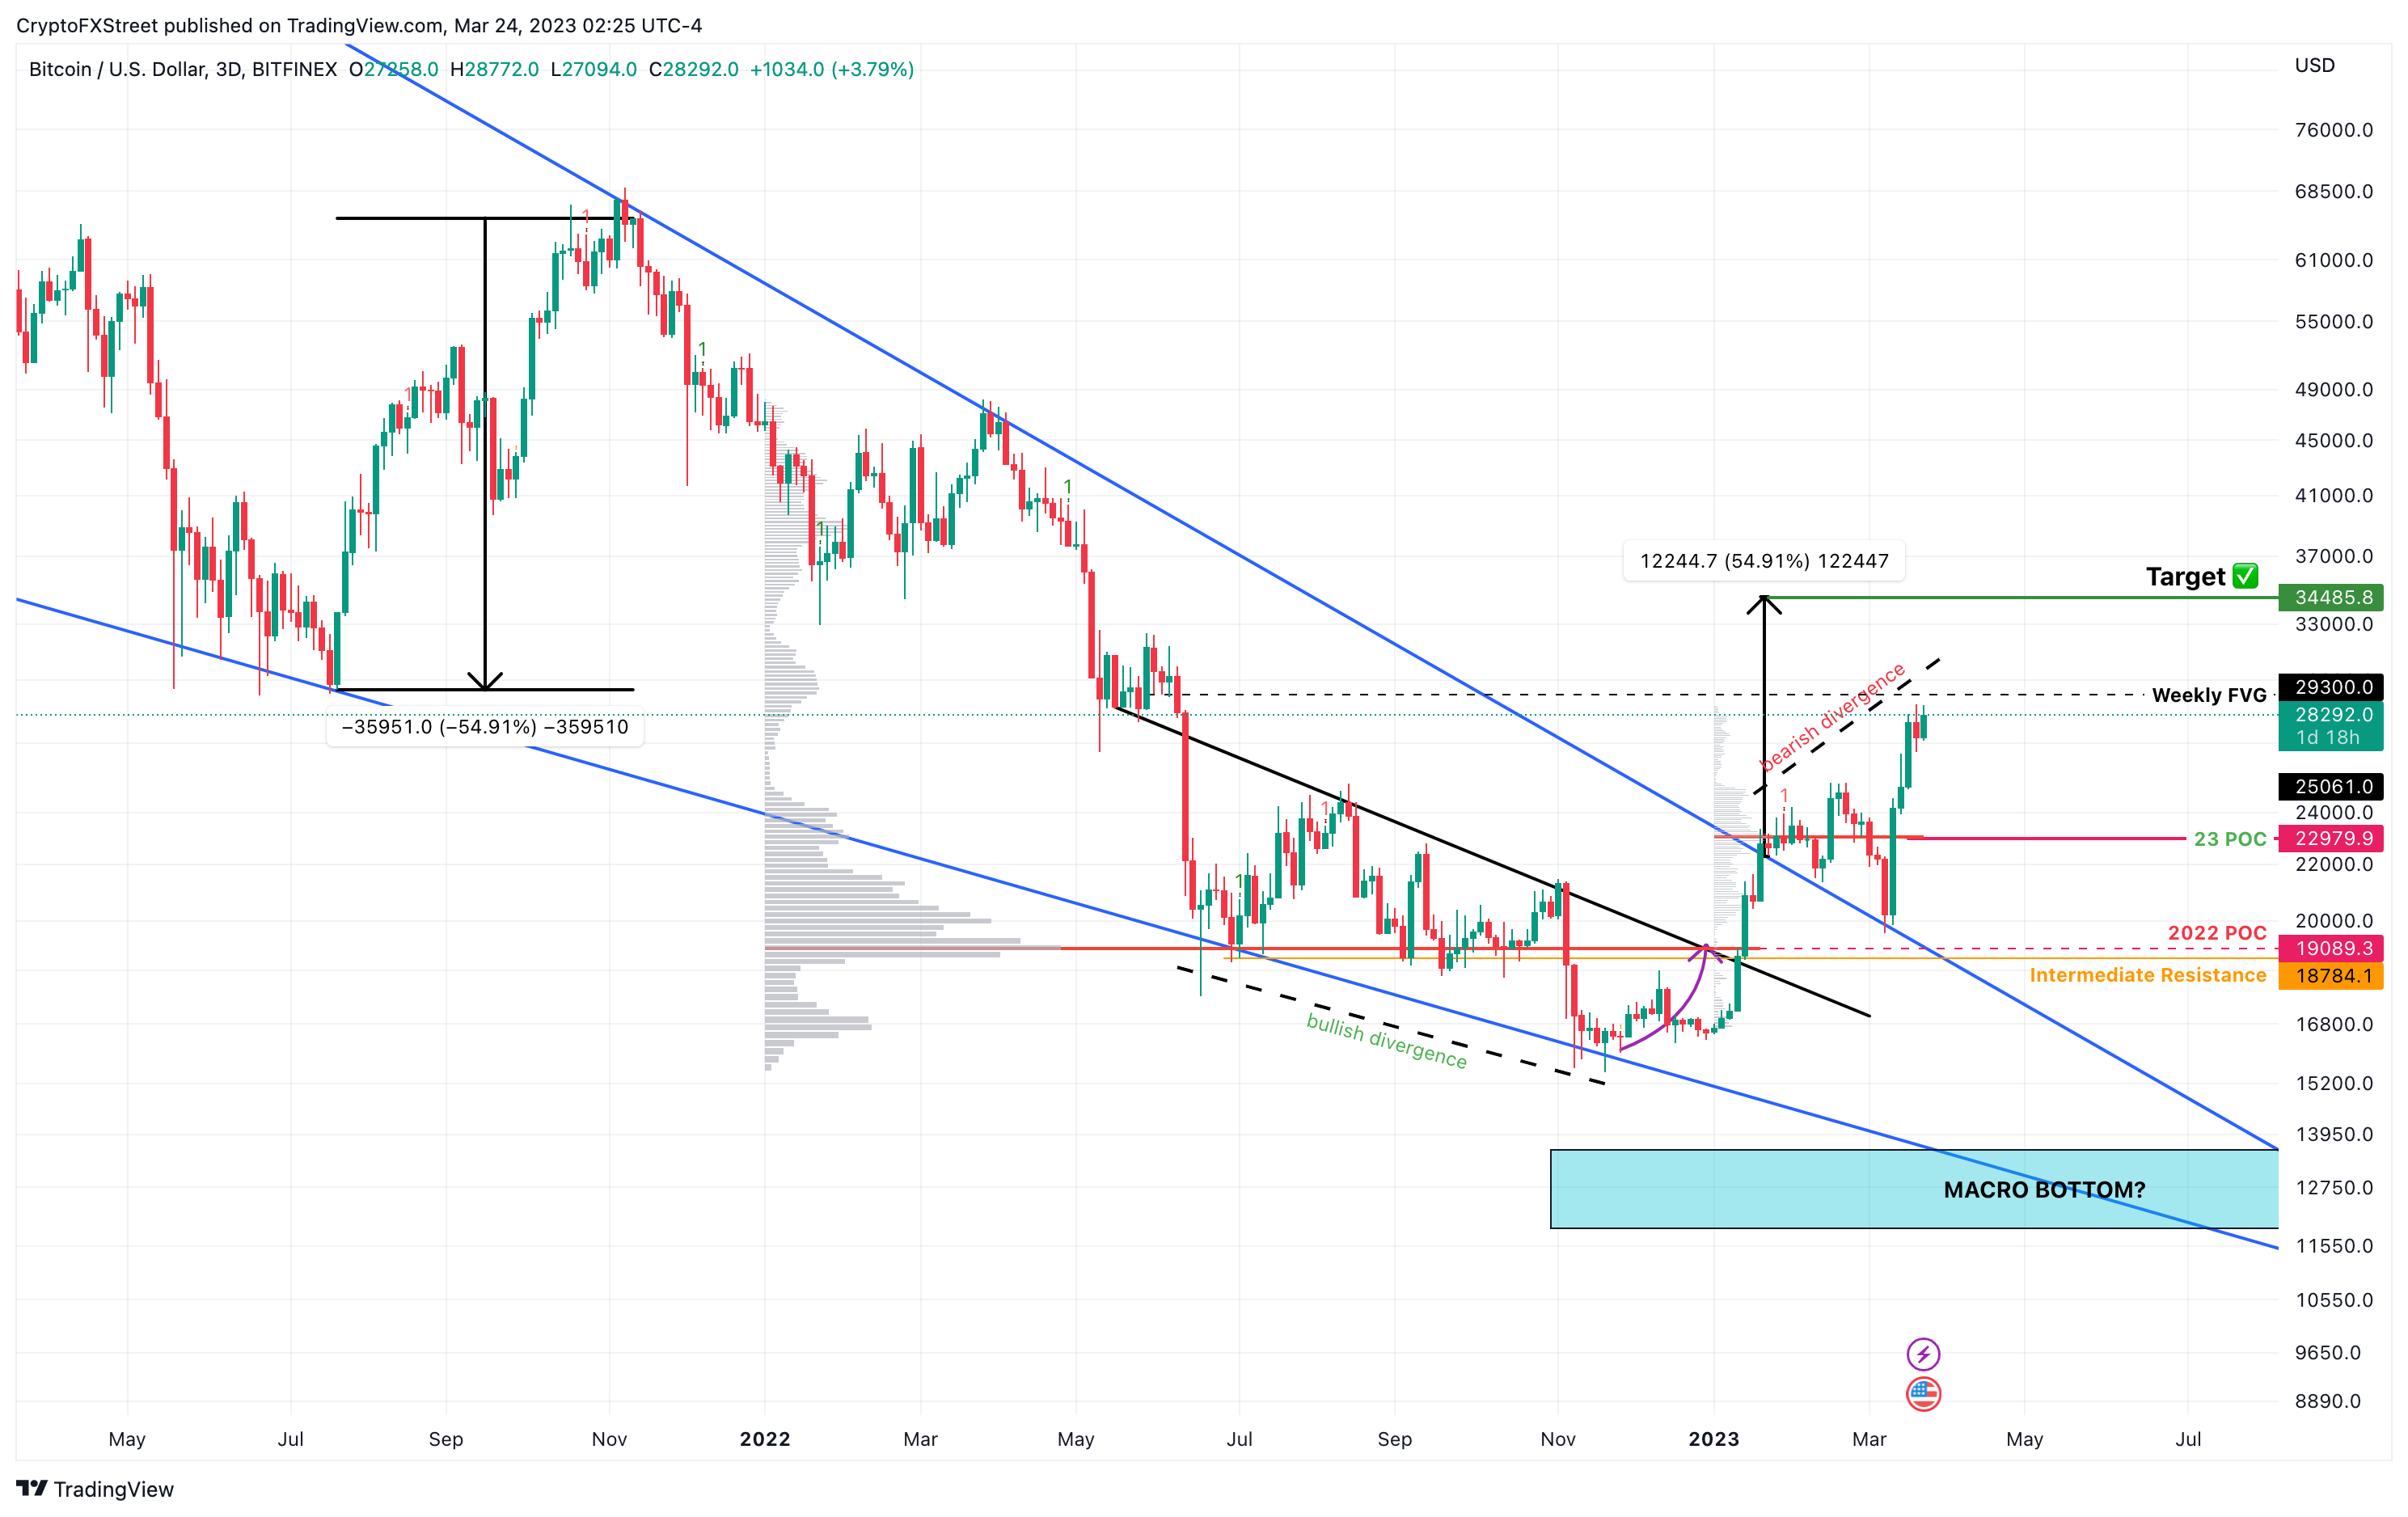
Bitcoin price action set up three distinctive swing lows and two swing highs as it dropped 77% between November 2021 and November 2022 from an all-time high at $69,000. These swing points, when connected using trend lines, reveal a falling wedge pattern.
So far, the pioneer crypto has rallied 26% from its breakout point at roughly $22,600. Bitcoin price has roughly 15% more to rally to meet the falling wedge’s theoretical target of $34,485. This target is obtained by measuring the distance between the first swing high and the swing low to the breakout point.
As Bitcoin price pauses its ascent, the Relative Strength Index (RSI) reveals a bearish divergence. This sell signal is obtained when the momentum indicator notes a steady decline while the underlying asset rises. The non-conformity that develops often results in a small pullback or a deep correction, depending on the market conditions.
Looking at the Awesome Oscillator, another momentum indicator, we cannot notice a bearish divergence, which reduces the overall confidence of a pullback, if any. If the macro outlook continues to worsen, causing widespread panic, then investors could pull out of BTC, triggering a sharp correction that will be in line with the bearish divergence’s sell signal. However, this outlook seems unlikely, considering the recent breakdown of the correlation of Bitcoin price with the US Dollar.
If any pullback does occur, the $24,000 to $25,000 range is a good place to accumulate BTC. This move will allow buyers to extend the rally by 36% and easily tag the final target of $34,485.
BTC/USDT 3-day chart
While the outlook for Bitcoin price is bullish, investors need to pay attention to the on-chain aspects of this rally. The short-term holder cohort has realized $292 million in profits; a level last seen in November 2021, just before BTC began its bear market.
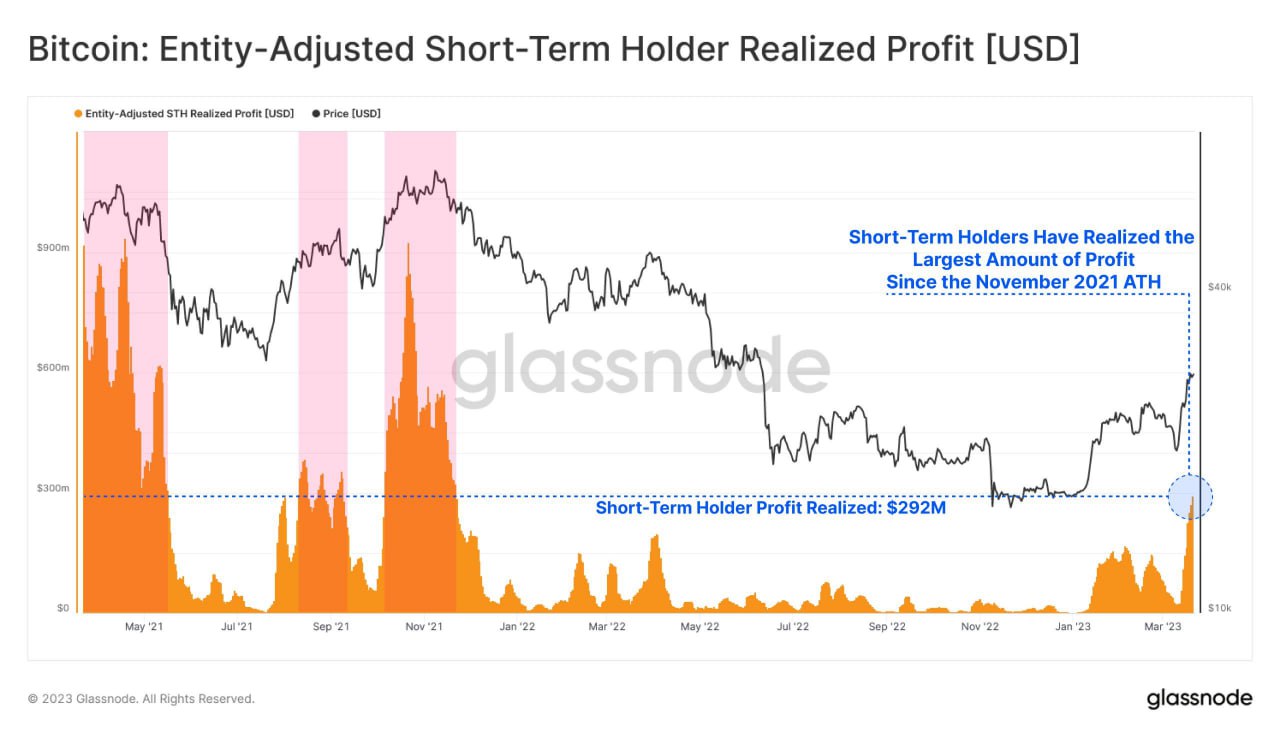
Entity-adjusted short-term holder realized profit
Additionally, the 365-day Market Value to Realized Value (MVRV) for Bitcoin price has flipped above the zero line and currently hovers around 24.76%, a level that was last seen in November 2021. This index reveals that these investors could offload their holdings and trigger a sell-off that fits the pullback perspective noted above.
 [11.56.09, 24 Mar, 2023]-638152385654513032.png)
BTC 365-day MVRV
On the other hand, if the sell-off continues without a stop due to macroeconomic reasons, investors need to watchout for the $19,600 support level, a breakdown of this structure creating a lower low would invalidate the bullish thesis.
Such a development could see Bitcoin price slide down to the $18,784 barrier and, in a dire case, crash 28% and retest the macro bottom range, extending from $11,898 to $13,575.
Author

Akash Girimath
FXStreet
Akash Girimath is a Mechanical Engineer interested in the chaos of the financial markets. Trying to make sense of this convoluted yet fascinating space, he switched his engineering job to become a crypto reporter and analyst.


