Bitcoin Weekly Forecast: BTC liquidates $300 million positions as it slips below $20,000, is the crash done?
- Bitcoin price slipped below the $20,000 psychological level, reaching early January levels.
- On-chain metrics reveal that roughly $1 billion worth of BTC was moved at a loss before the sell-off.
- The bearish outlook could see the big crypto slide as low as $17,000 in the upcoming days, especially if it shatters critical support levels.

Bitcoin price witnessed a steep correction that has knocked it below a key psychological level. The massive sell-off caused $303 million worth of liquidations in the last 24 hours as traders were caught off guard. But the long-term outlook shows that BTC is right where it should be. There is a chance for a recovery rally to originate, but investors should not hold their breath.

Total liquidations
Also read: Could Voyager’s selling spree drive Ethereum price further into the ground?
Bitcoin price action and where it stands
Bitcoin price shows that it has ventured into the weekly Fair Value Gap (FVG), extending from $20,386 to $17,181. FVG is an imbalance that occurs when one side of the camp takes over. In this case, there was an imbalance created by BTC buyers in early January, which led to a 21% return on a weekly candlestick.
As Bitcoin price skyrocketed, it left a gap that was untouched by the subsequent candlestick, leaving an imbalance in its wake. Typically these gaps are filled as the asset drives back into it, rebalancing the inefficiencies.
Interestingly for Bitcoin price, this FVG caused a shift in the market structure favoring the bulls, i.e., BTC set up a higher high relative to the October 31 swing high at $21,473. Such a development would suggest that the bullish outlook still persists on a high timeframe and that the current retracement is a good opportunity to accumulate.
As long as Bitcoin price remains above November 2022 swing lows at $15,462, the weekly chart will show a bullish structure. With that in mind, an accumulation between $20,000 and $18,800 seems to be the best way to go.
However, investors also need to keep a close eye on the weekly Relative Strength Index (RSI), which has slipped below the midpoint after the recent sell-off. If bulls are in control, the weekly RSI should climb back above the 50 level and hold.
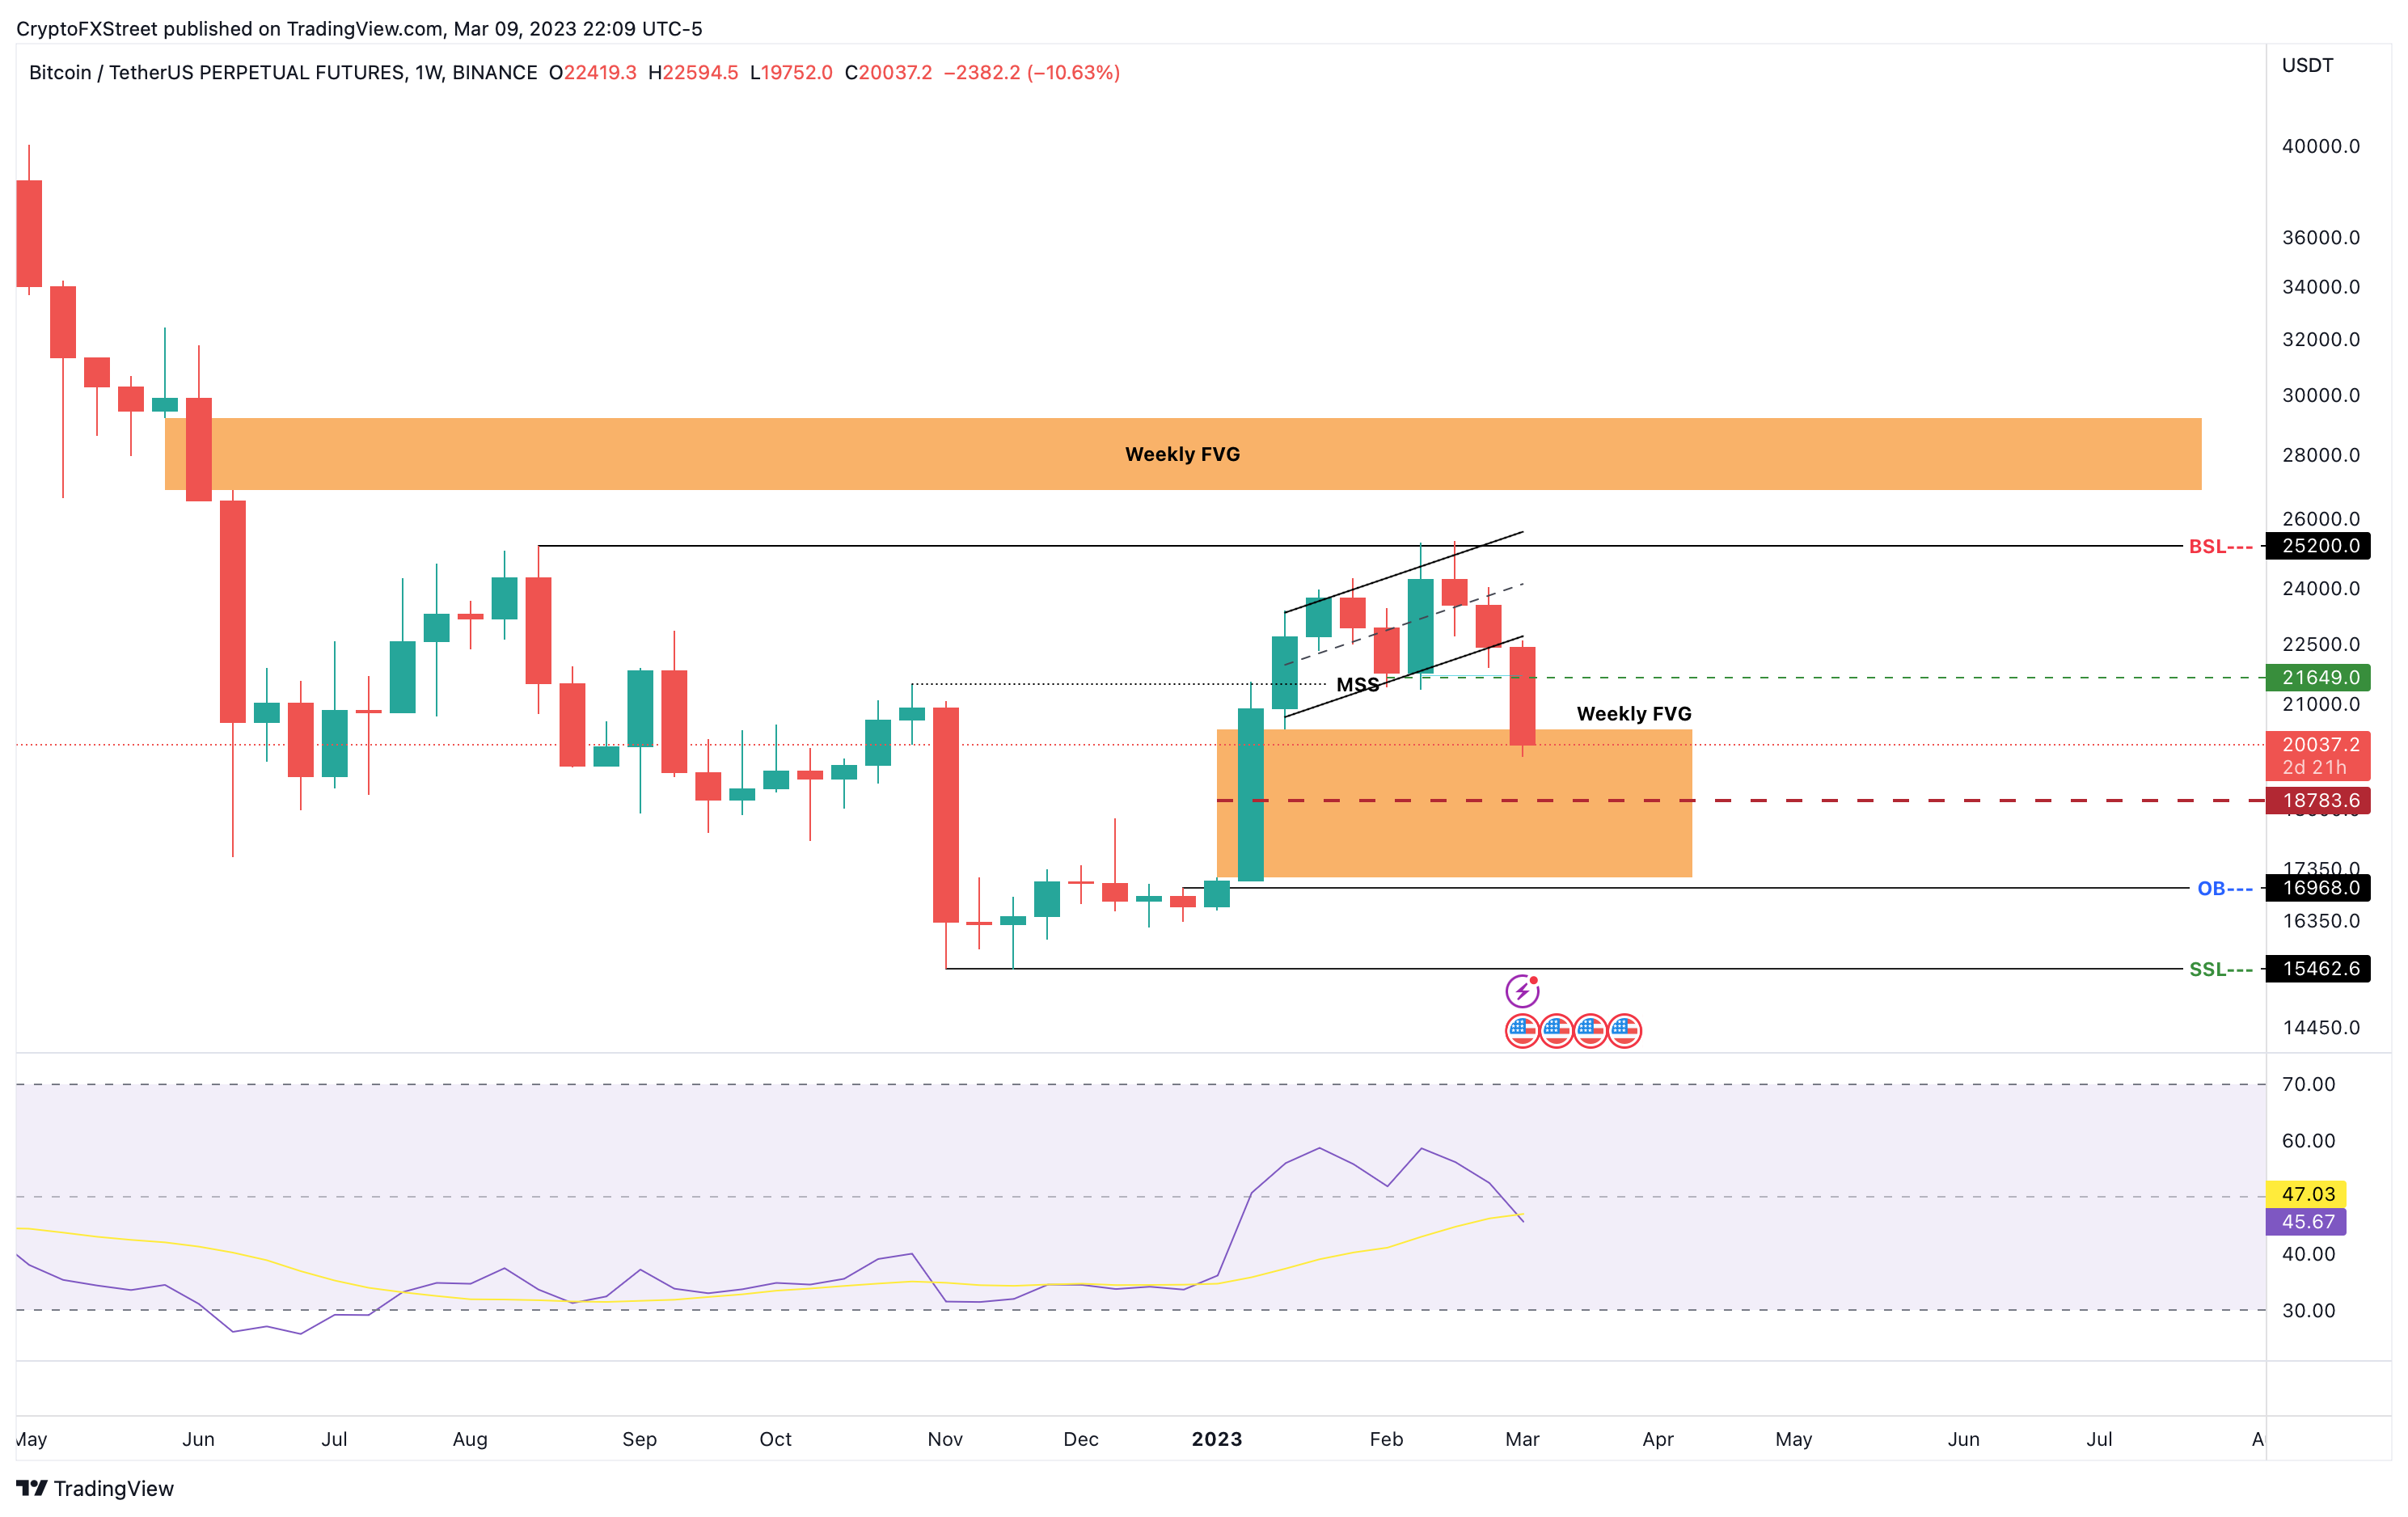
BTC/USDT 1-week chart
Requirements for BTC to recover and rally
On a daily chart, Bitcoin price is currently being supported by the 200-day Exponential Moving Average (EMA) at $20,068. Resting just below it is the 200-day Simple Moving Average (SMA) at $19,320 and the midpoint of the weekly FVG at $18,783.
The aforementioned levels will serve as support, but in case of a failure to hold above all these levels, Bitcoin price could tag the weekly orderblock at $16,968.
From a conservative standpoint, investors should presume that Bitcoin price could slide as low as $17,000 and plan their accumulation journey accordingly.
The recovery of Bitcoin price will be reliant on two things.
- The Non-farm Payrolls (NFP) and Consumer Price Index (CPI) macroeconomic events.
- Investors’ capacity to accumulate.
The macroeconomic events are likely to stir up volatility again, so investors need to stay put until after these events. After the CPI announcement on March 14, investors need to look for a few things to gauge investors' capacity to accumulate.
Also read: Will Bitcoin begin its recovery rally ahead of US Nonfarm Payrolls data?
On-chain signs of a recovery rally
Stablecoin whales accumulation pattern: This indicator will showcase the raw power with high networth individuals and if they are looking to accumulate. The last time whales holding 100,000 to 10,000,000 stablecoins saw a spike was in late January and early February, which propelled BTC to $25,000.
 [09.32.03, 10 Mar, 2023]-638140269388051255.png)
Stablecoin whales supply distribution
Whale transaction count: This on-chain metric tracks the number of transactions worth $100,000 or more and serves as a proxy of these whales’ investment interests. If this indicator shows a spike after a huge drop, it could signal a buying opportunity.
This metric has been showing a consistent spike above the 50-day average since early February, suggesting that investors were moving their holdings long before the March 9 crash. If this indicator lights after a steep correction, it could indicate the opposite i.e., investors are accumulating.
 [09.35.31, 10 Mar, 2023]-638140269629349533.png)
Whale transaction count
BTC Supply Distribution: This on-chain metric showcases BTC whales holding between 100 BTC and 10,000 BTC. An uptick in the number of wallets holding this much Bitcoin could indicate an accumulation pattern at the current levels and might suggest a potential recovery rally.
 [09.37.56, 10 Mar, 2023]-638140269813935577.png)
BTC supply distribution
The only way Bitcoin price could invalidate the long-term bullish outlook is if it slips below the $15,462 hurdle. A failure to stay above this level on a weekly timeframe would confirm a lack of buying pressure and invalidate the bullish thesis.
This development could see Bitcoin price nosedive to the next immediate support level at $12,898.
Author

Akash Girimath
FXStreet
Akash Girimath is a Mechanical Engineer interested in the chaos of the financial markets. Trying to make sense of this convoluted yet fascinating space, he switched his engineering job to become a crypto reporter and analyst.




