Bitcoin Weekly Forecast: Reversal signs push BTC holders to tread cautiously
- Bitcoin price shows an early sell signal on the weekly timeframe in addition to grappling with the 200-weekly SMA.
- On-chain metrics reveal a decline in momentum as whales stop their accumulation and look to offload their holdings.
- The bullish thesis confirmation will arrive if BTC flips the $25,200 resistance confluence.

Bitcoin (BTC) price is in limbo and has been grappling with coinciding hurdles on multiple timeframes for nearly two weeks. As bulls and bears fight for control, altcoins are in chaos; some are exploding, others are pulling back after quick and impressive gains,
Also read: Bitcoin bears attempt to pin BTC price under $23K ahead of this month’s options expiry
Bitcoin price in jeopardy on the big picture
Bitcoin price on the weekly chart shows three important aspects - the 200-weekly Simple Moving Average (SMA) coinciding with the resistance level denoted by Momentum Reversal Indicator (MRI). The premature sell signal denoted by a yellow down arrow is also from the MRI, and it indicates that another weekly candlestick could trigger a sell signal for BTC.
If successful, this formation forecasts a one-to-four down candlestick for Bitcoin price. Therefore, market participants need to be cautious.
The three-day chart for Bitcoin price shows that the bounce from the bullish breaker, as described in the previous weekly forecast, manifested an 18% upswing. While the short-term view reveals this as a bullish development, the last three weeks of price action indicate a bearish outlook.
In particular, Bitcoin price has developed a bearish divergence on the three-day chart. This technical formation contains the underlying asset’s price producing higher highs without the backing of the momentum indicator, which is displaying lower highs.
This non-conformity between the two often leads to a trend reversal. And since Bitcoin price is grappling with a resistance confluence at $25,200 on the weekly chart, the retracement from the bearish divergence is a question of “when” and not “if”.
The weekly chart shows that the nearest support level for Bitcoin price is $21,867. But the three-day chart shows the 50-day Exponential Moving Average (EMA) at $22,127 will likely dampen the potential selling pressure.
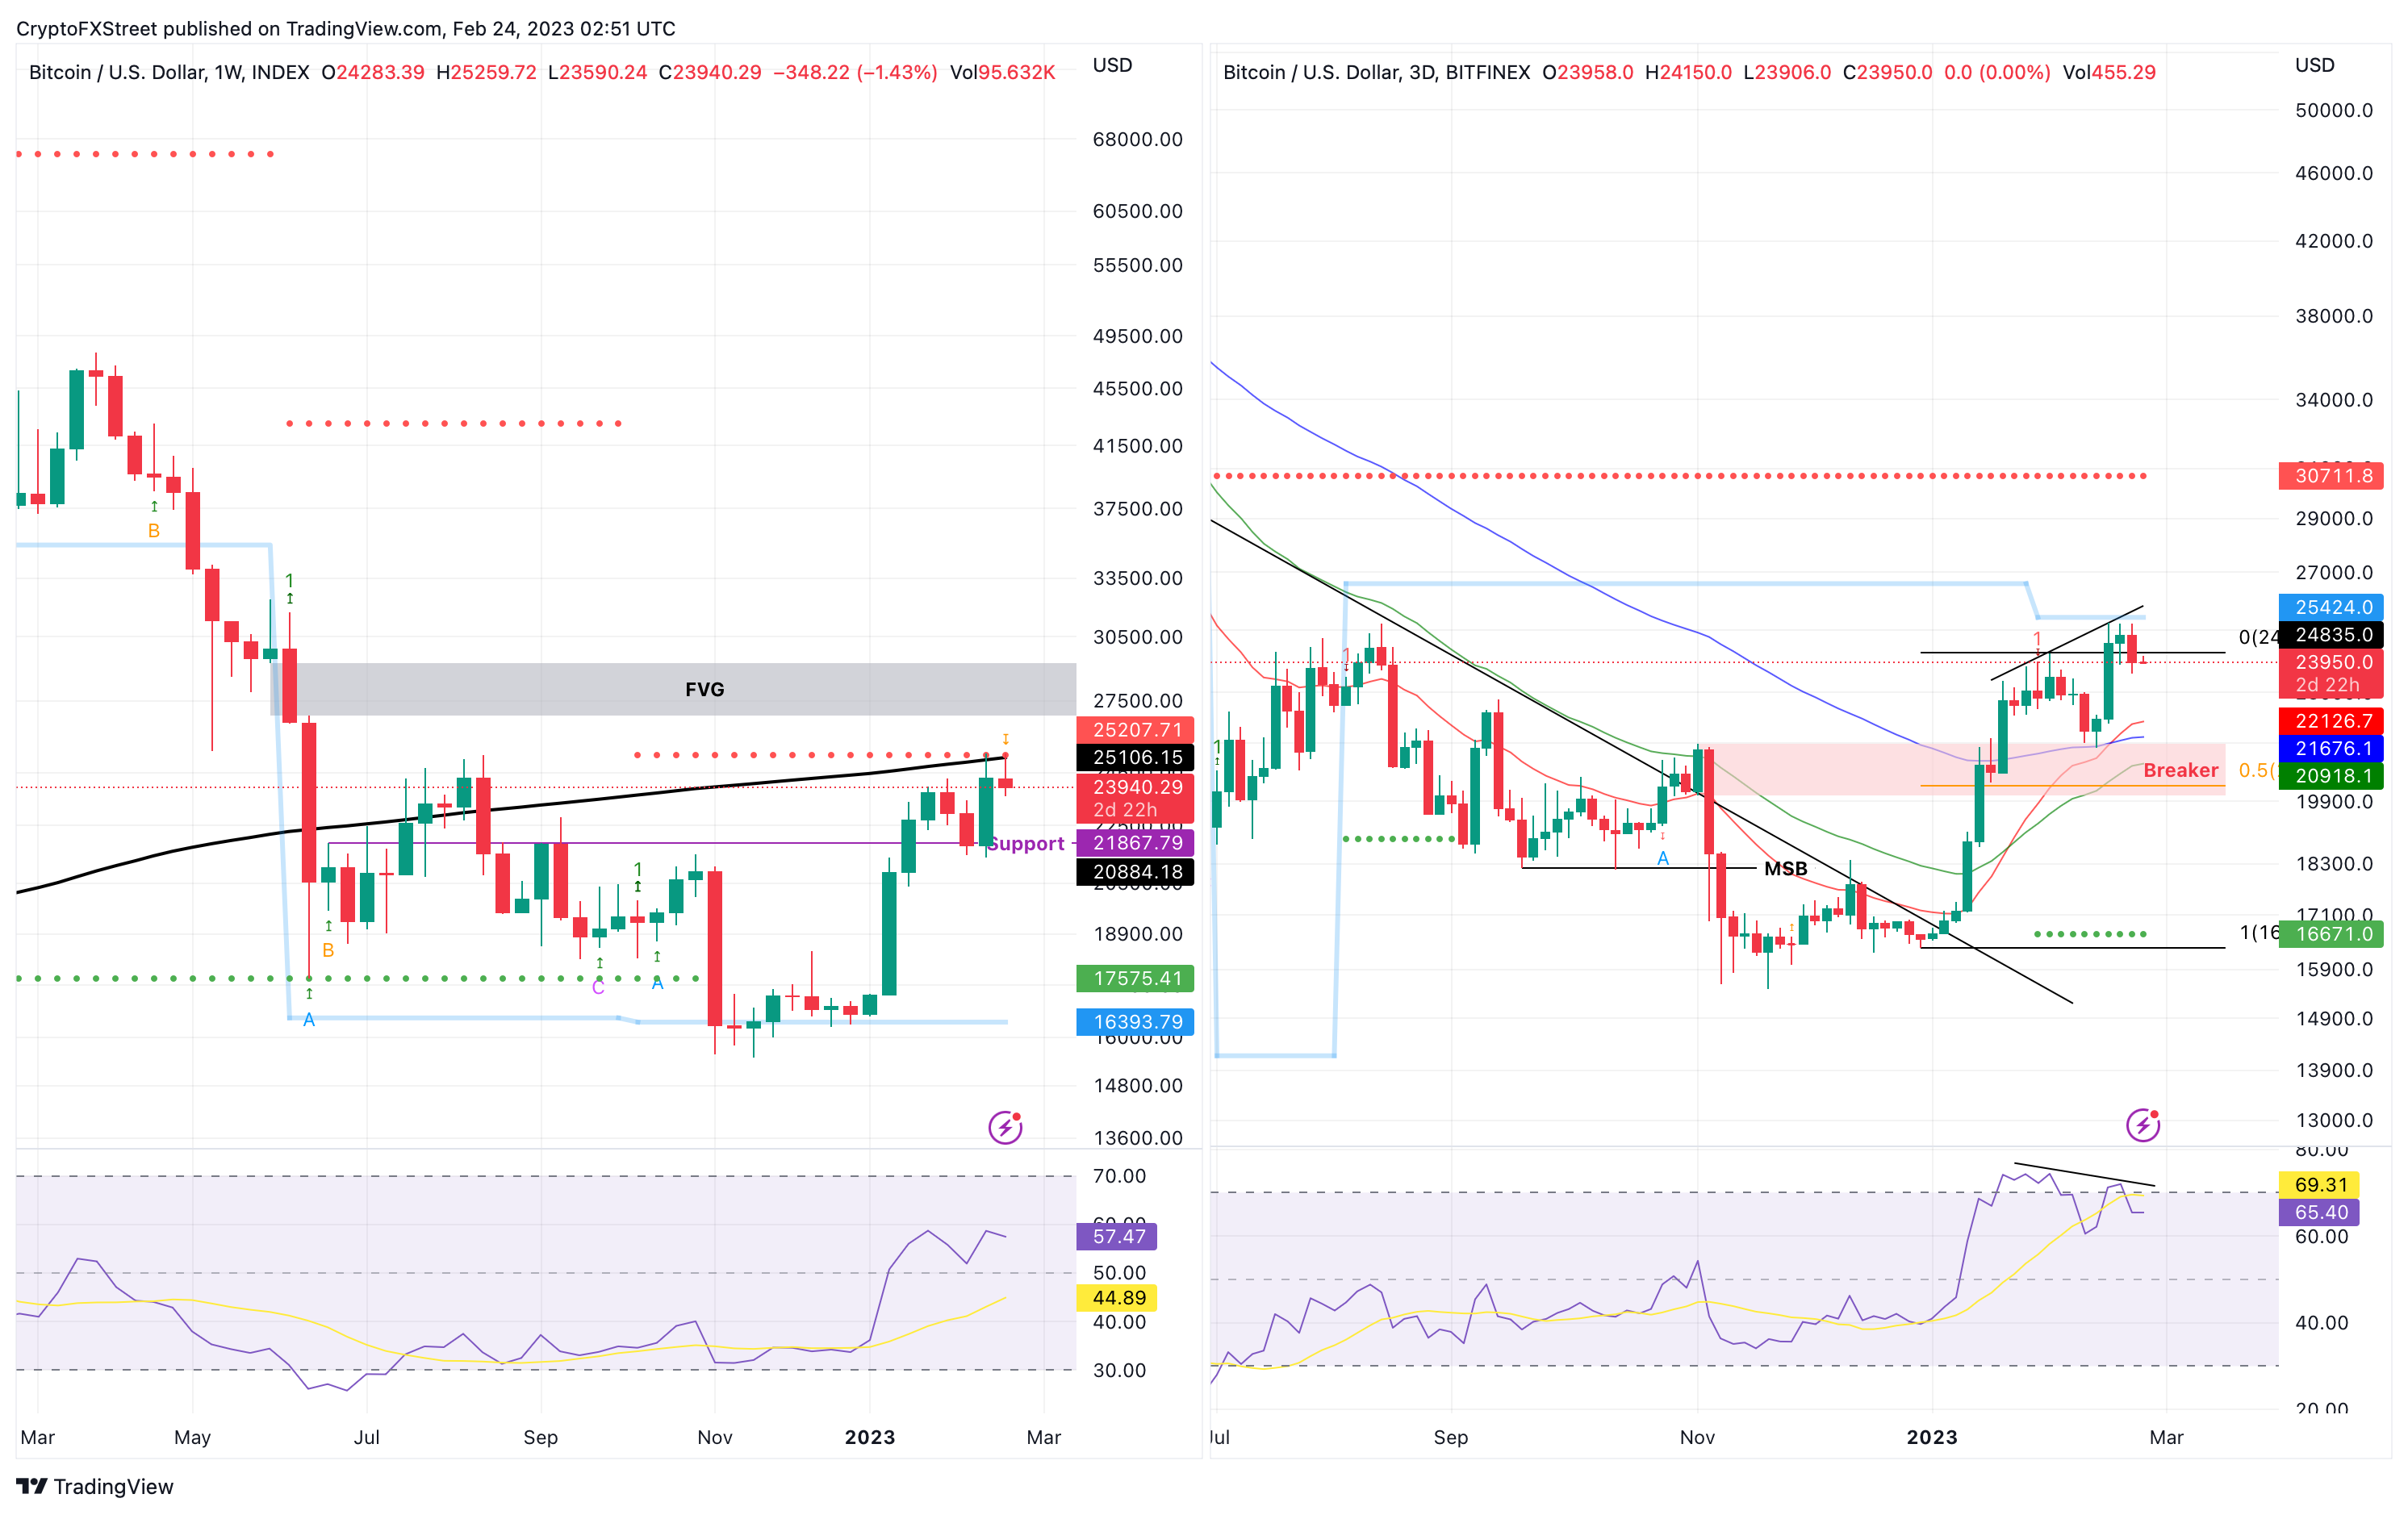
BTC/USDT 1-week, 3-day charts
Making a case for manipulation next week
The daily chart offers a much more nuanced view of Bitcoin price. The $25,211 hurdle is important and coincides with resistance levels on higher timeframes. But, the daily chart reveals that BTC has set up multiple equal highs around this level, creating a pool of buy-side liquidity.
Hence, there might be manipulation from market makers or smart money traders that would purposely push Bitcoin price higher. This move would accomplish two things - invites bulls to be trapped later and flush early bears that are trading based on obvious sell signals.
As BTC collects buy-side liquidity to the upside, it could invalidate many short-sellers. But a quick reversal that pushes BTC below the recent lows at $23,516 would also invalidate the long positions.
Such a move that traps both camps would be ideal for kick-starting a retracement to $21,699, which is the 200-day EMA. Beyond this immediate foothold, BTC has the 200-day SMA acting as a support level at $19,756.
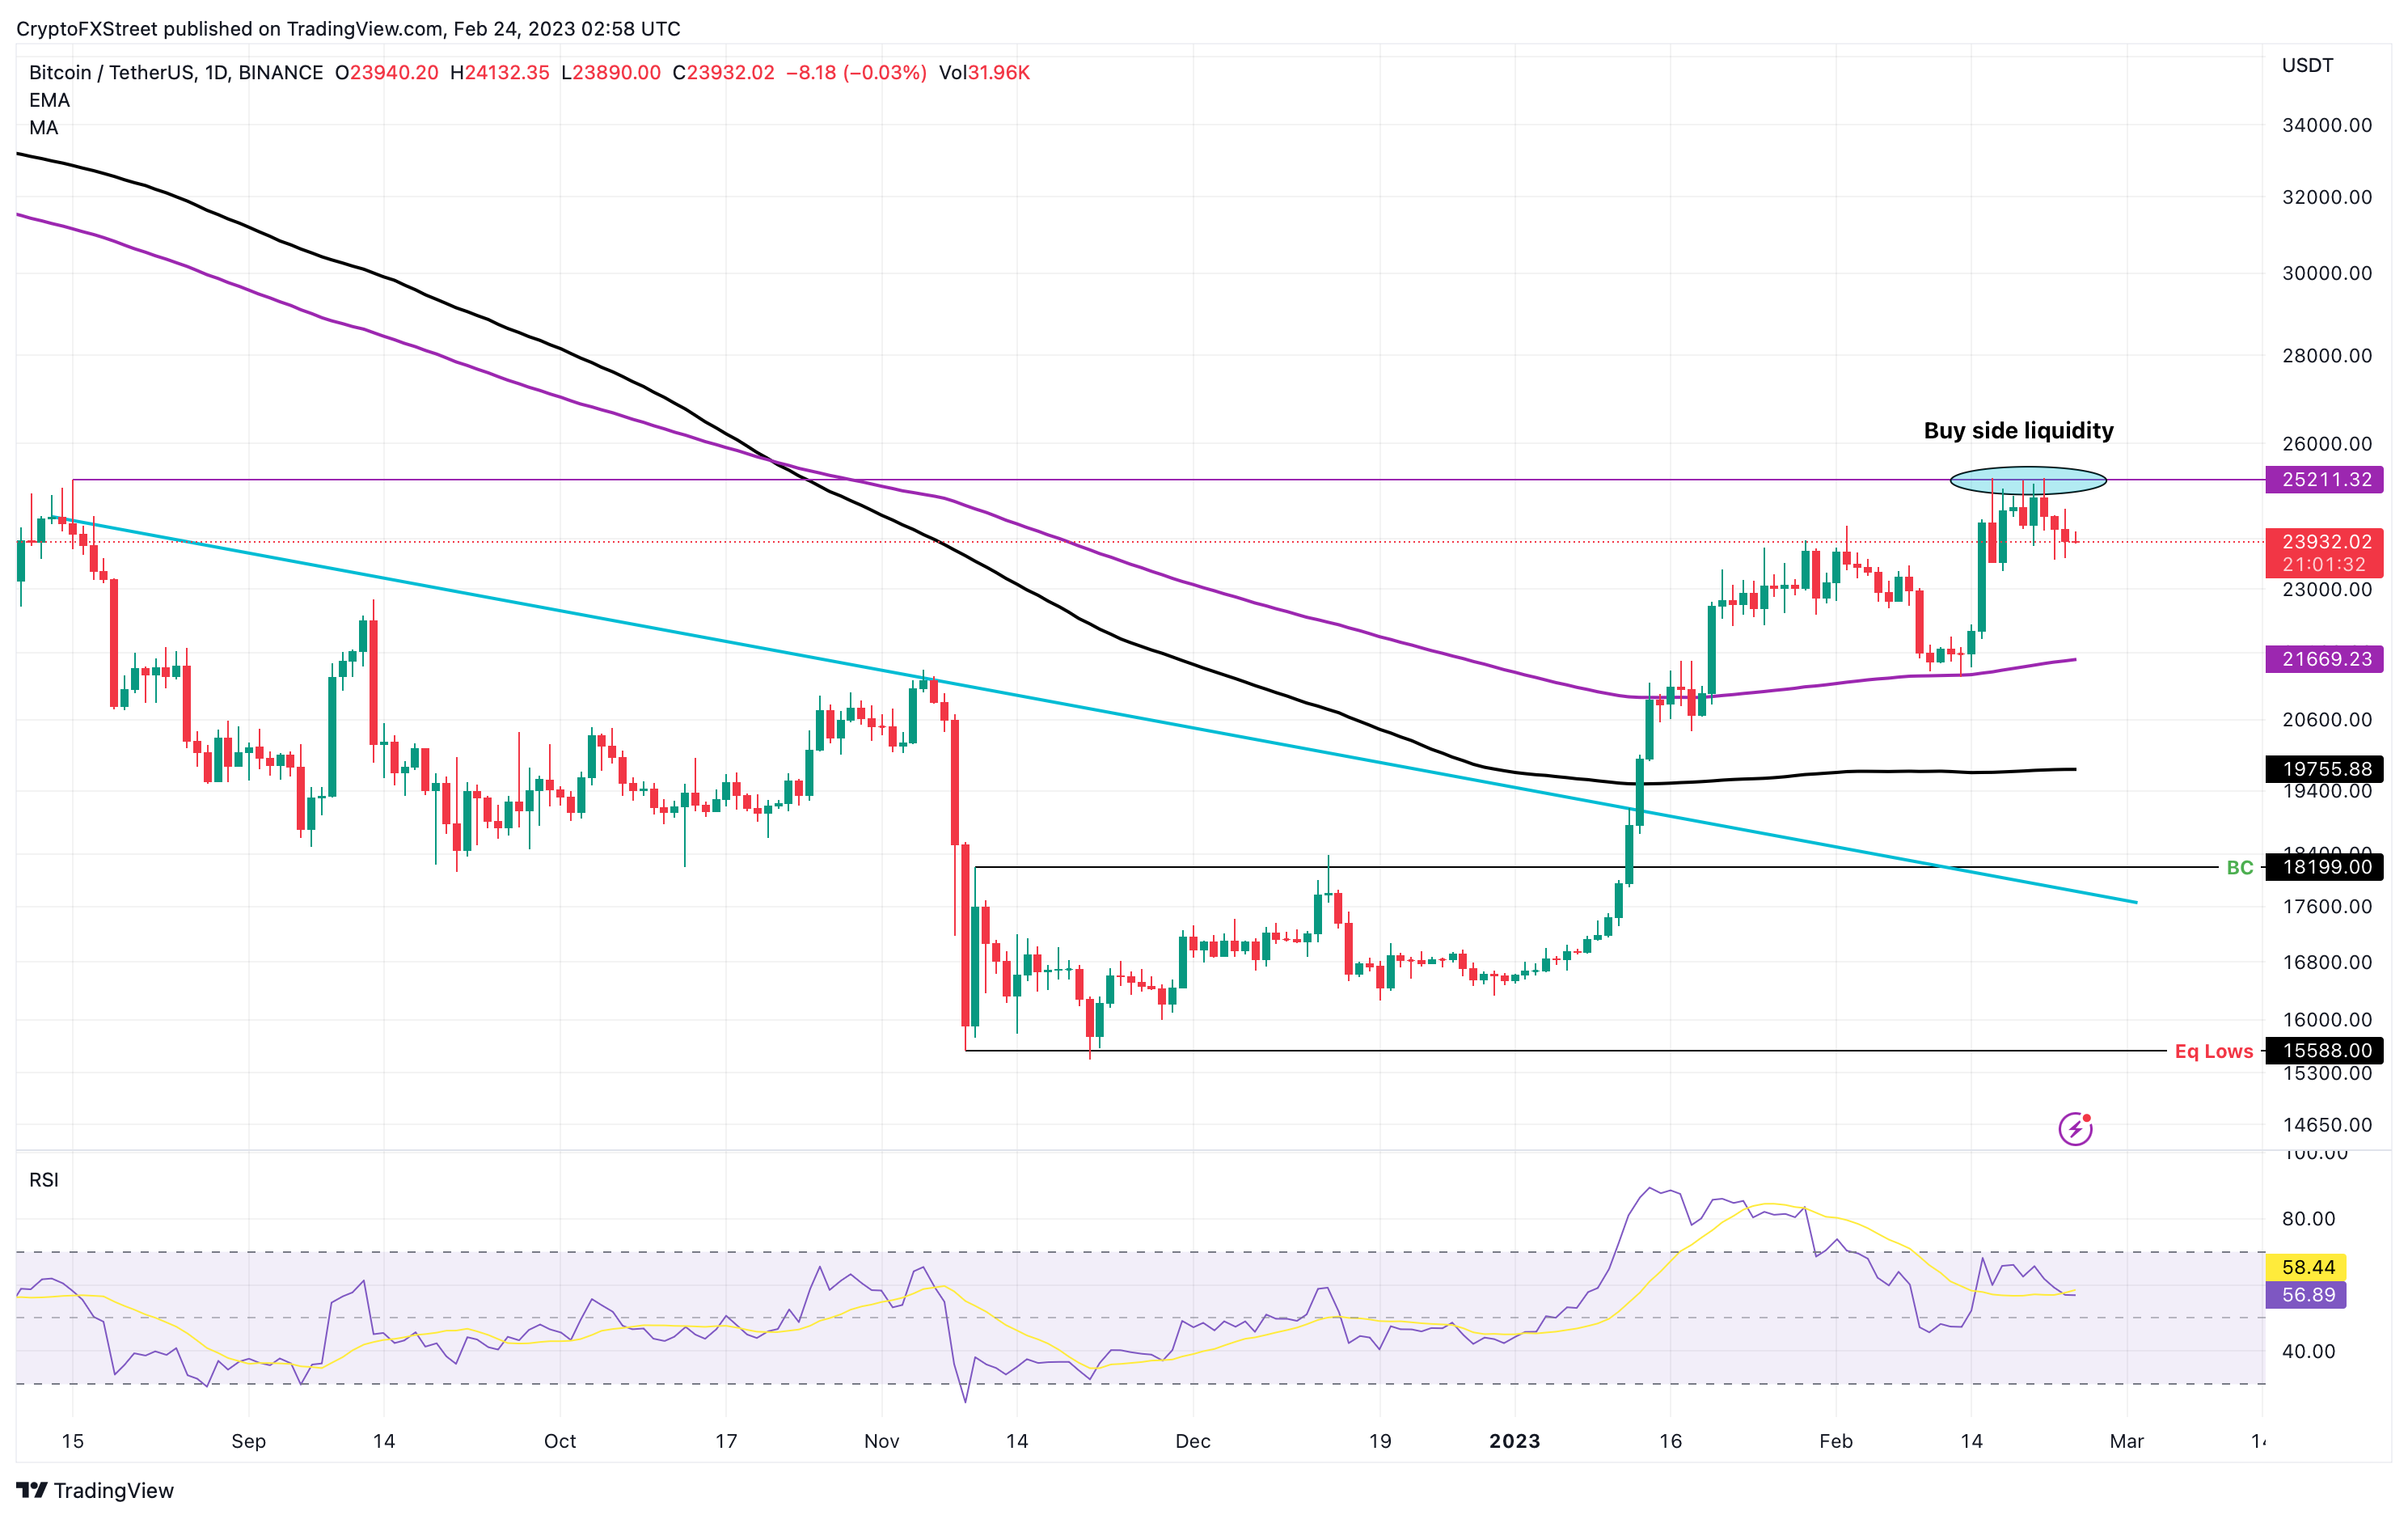
BTC/USDT 1-day chart
BTC whales remain neutral as directional bias disappears
While the bullish scenario will likely be kept on hold until certain conditions are met, on-chain metrics reveal that whales have stopped accumulating. The number of wallets holding 100 to 10,000 BTC has been hovering between 16,000 and 15,950 for over two months.
Such a consolidation indicates no interest to accumulate from these buyers.
Furthermore, the on-chain transaction volume for BTC has dropped from a high of 42 billion BTC to 29 billion. This sudden decline further ascertains the bearish divergence noted from a technical standpoint on the three-day timeframe.
Hence, a retracement is due for the largest crypto asset by market capitalization.
 [08.03.37, 24 Feb, 2023]-638128073723275670.png)
BTC supply distribution
The Whale Transaction count metric provides the final blow to investor confidence. This index tracks transactions worth $1 million or higher and is a proxy of high networth investors' sentiment. If the count of these large transactions shows an uptick after a run-up, it indicates that these entities are looking to book profits. But sometimes, the index shows a high activity after a sudden drop, which reveals that the whales are accumulating.
This index can serve as a sell or buy signal based on market conditions. After Bitcoin’s new year rally pushed it up by 48%, whale transactions worth $1 million or higher have stayed above the seven-day average, suggesting that profit-taking is certainly on the agenda for BTC holders.
 [08.03.42, 24 Feb, 2023]-638128073966699321.png)
BTC whale transaction
As appealing as the bearish thesis is, investors should be cautious of getting trapped as a part of smart money traders’ plans. The best level to short BTC would be after a sweep of the recent swing high of $25,211.
Conversely, if Bitcoin price produces a weekly candlestick close above the 200-week SMA at $25,207, it would be a massively optimistic development. Such a move would achieve three things - invalidate the short-term bearish outlook and potential retracement opportunities noted above, attract sidelined buyers to accumulate and potentially trigger the weekly sell signal from MRI. Depending on the momentum of the new investors, Bitcoin price could decisively kick bears out of the arena and trigger a run-up to the next psychological level at $30,000.
Author

Akash Girimath
FXStreet
Akash Girimath is a Mechanical Engineer interested in the chaos of the financial markets. Trying to make sense of this convoluted yet fascinating space, he switched his engineering job to become a crypto reporter and analyst.


