Bitcoin Weekly Forecast: Is this the start of BTC’s journey to $28,000?
- Bitcoin price triggered a bullish reversal after October 13 CPI that is reminiscent of the July 13 events.
- The transaction data shows that a flip of $22,000 will open the path for BTC to head up to $27,000.
- A breakdown of the $18,900 support level will spell trouble and could catalyze a steep correction to $15,550.

Bitcoin price witnesses a massive surge in volatility after the release of the US Consumer Price Index (CPI) on Thursday. An initial drop in BTC price is later taken over by buyers, resulting in a sharp move to the upside. CPI came out at 8.2% – above the 8.1% forecast, and Bitcoin price tumbled to $18,190 as expected, given expectations of continued aggressive rate-hiking from the Fed and a stronger US dollar. BTC price quickly recovered, however, rising back up to touch highs of $19,500. Going forward, high-impact news that affects the stock market will also continue to affect the big crypto due to the tight correlation between the two. However, an interesting development is brewing behind the scenes that hints at a potential start of a bullish regime, at least, in the short term.
Bitcoin price and rising correlation with the stock market
Bitcoin price has been correlated with the stock market with the correlation coefficient hovering between 0.1 to 0.7 up to November 2021. Since 2022, however, the correlation has strengthened with the figure staying in the upper limits of 0.90 or higher for longer durations.
Another interesting observation is that there have been four distinctive drops in correlation over the last four months, and two of these coincide with the CPI announcements.
On July 13, the correlation plummeted from 0.88 to 0.16 after the CPI came in at 9.1%, higher than the expected 8.8%.
On October 13, the correlation stooped from 0.75 to 0.31 after the CPI announcement was 0.1% higher than the expected 8.1%.
Although both these drops coincided with CPI coming in hotter than expectations, the July 13 drop in BTC price then catalyzed a 33% rally. If history were to repeat itself, yesterday’s drop in Bitcoin price could be the start of another rally.
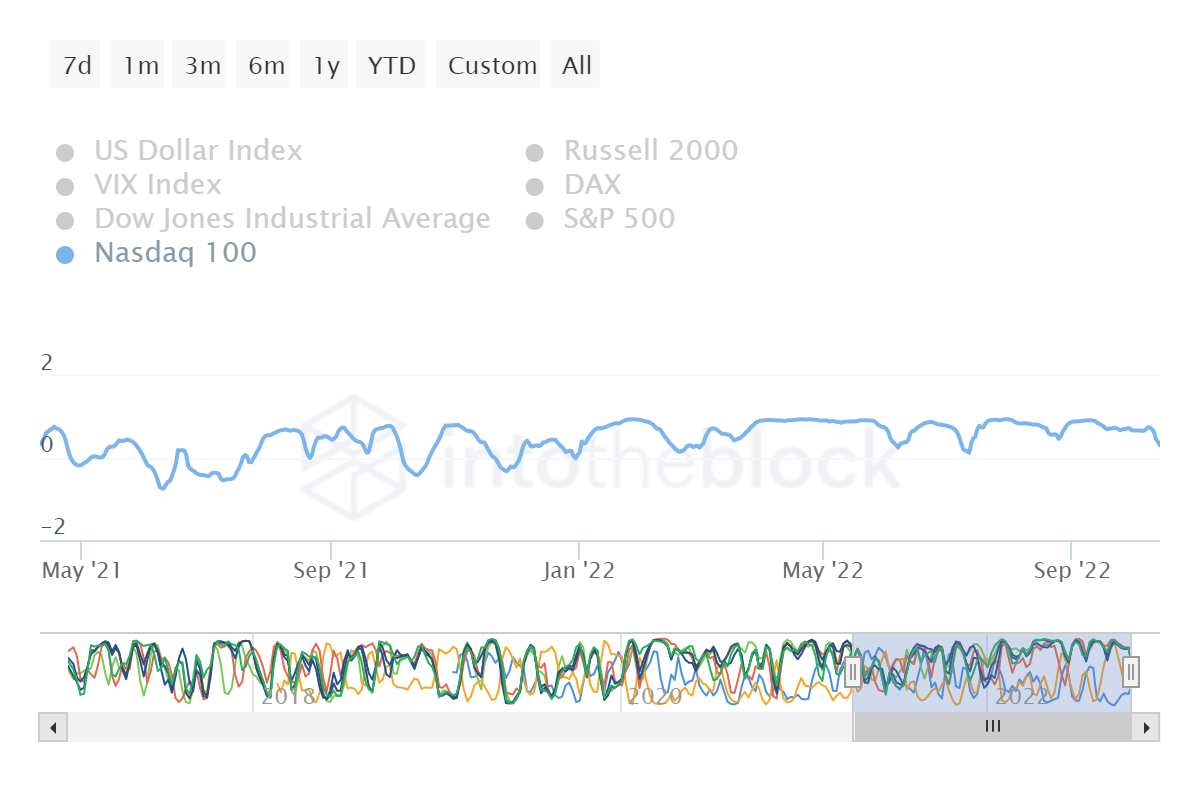
BTC vs. Nasdaq 100 correlation
If the bullish thesis holds true, the four-hour chart shows that the ideal place for accumulation is the midpoint at $18,935 or roughly $19,000. A confirmation of this upswing will arrive after BTC produces a daily candlestick close above the 30-day Exponential Moving Average (EMA) at roughly $19,600.
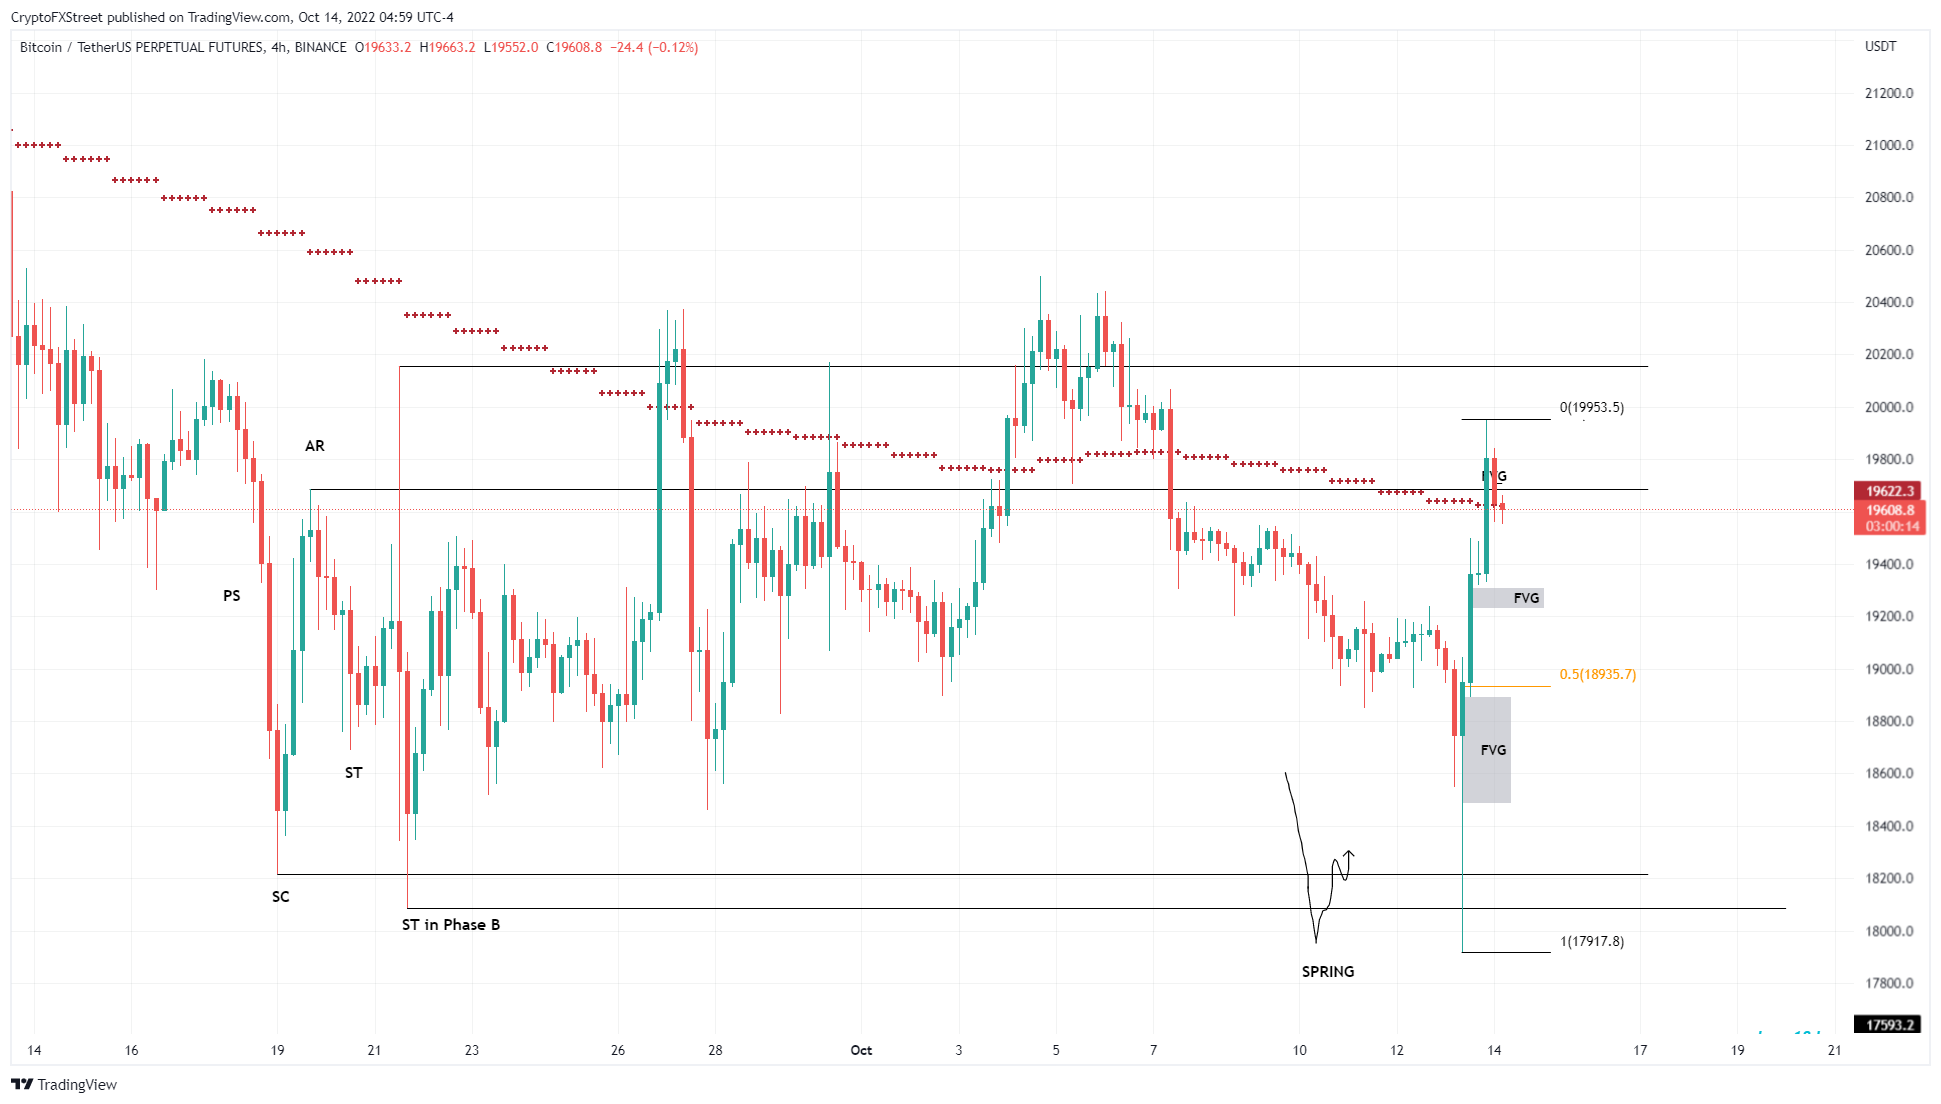
BTC/USDT 4-hour chart
If buyers step in, the resulting bounce in Bitcoin price could be the start of a rally that pushes it up to retest the $25,000 psychological level. Since the aforementioned barrier is a significant hurdle, investors should consider booking a portion of their profits to cover their risk.
But a flip of the $25,000 level into a support barrier will be a sign that bulls are back in town. In such a case, market participants can expect BTC to make a run for the $28,000 to $29,000 levels. Interestingly, these levels are where the Chicago Mercantile Exchange’s (CME) Bitcoin price data forms gaps every weekend.
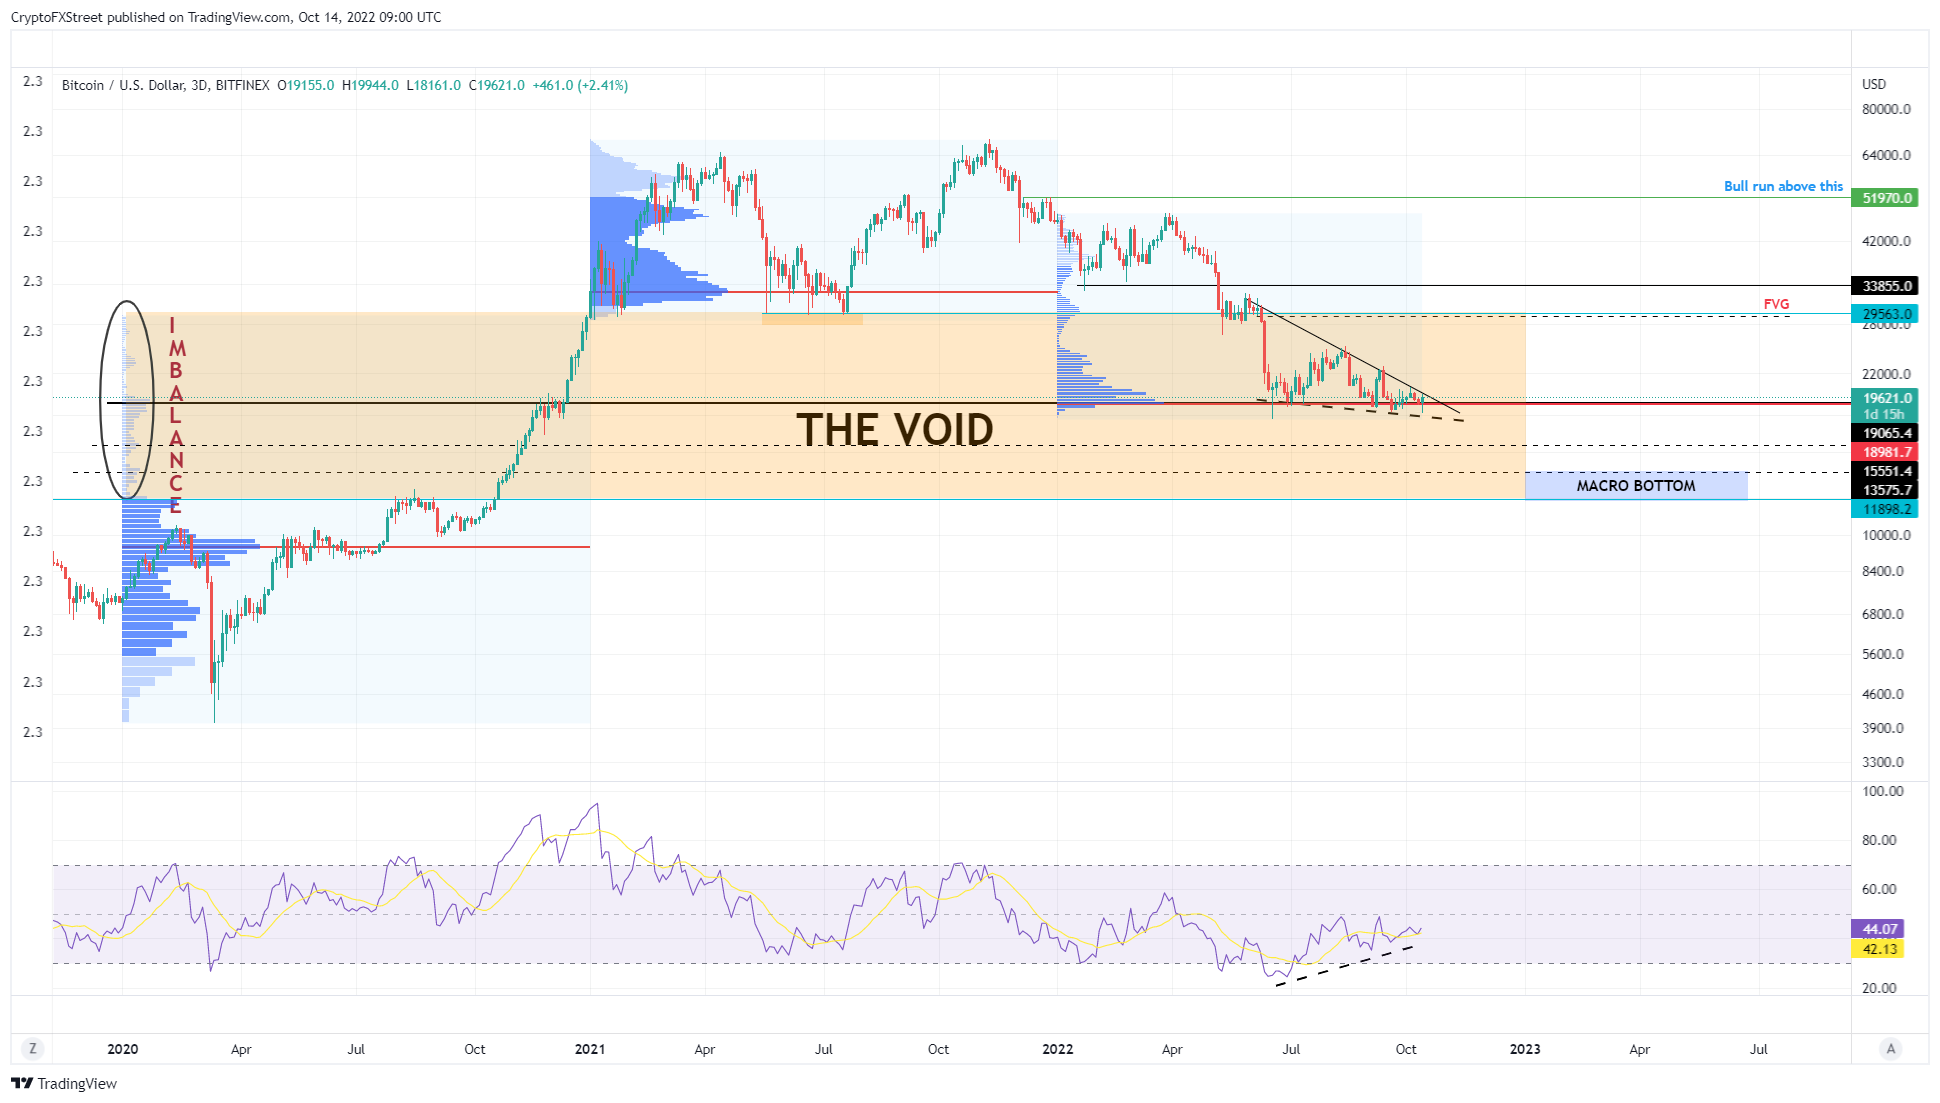
BTC/USDT 1-day chart
Supporting this push to $27,000 or higher is the transaction data obtained from IntoTheBlock’s Global In/Out of the Money (GIOM) model.
This on-chain metric shows that roughly 5.24 million addresses that purchased nearly 3.2 million BTC at an average price of $21,450 are “At the Money.” So a flip of this hurdle into a support floor could give these investors a chance to add more to their holdings, resulting in a spike in buying pressure that pushes Bitcoin price higher.
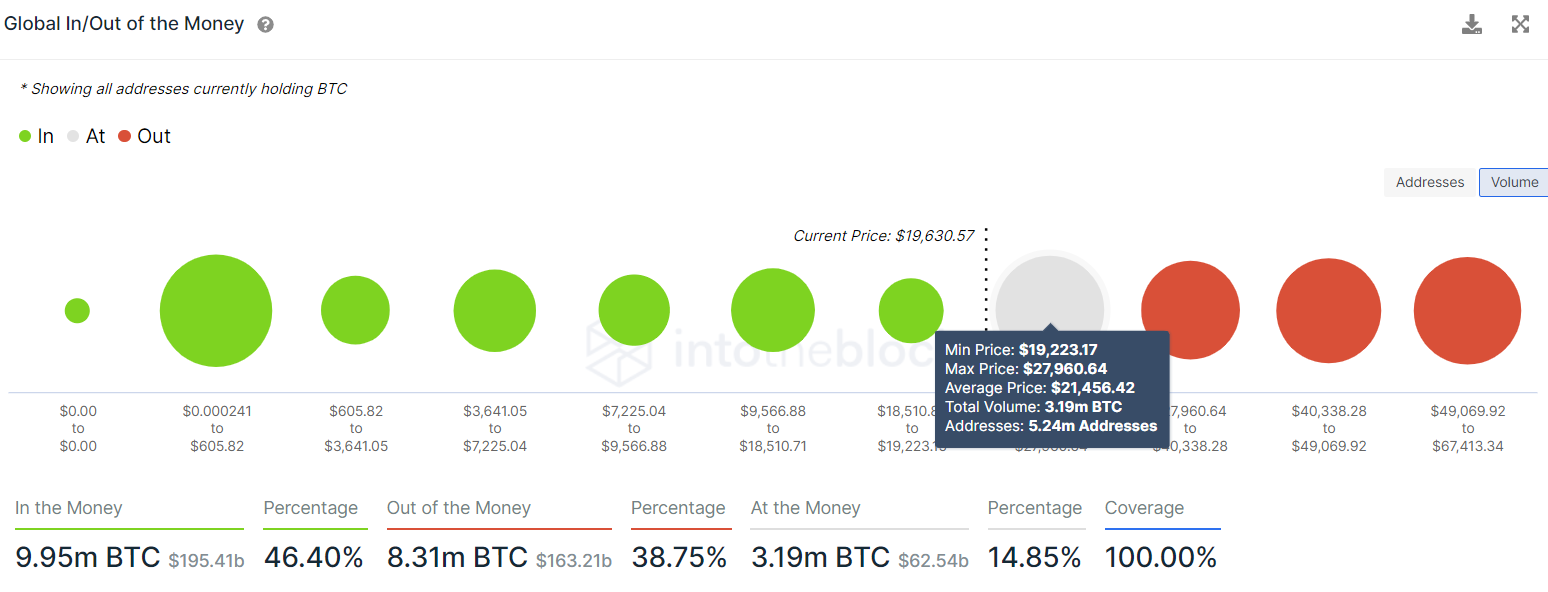
BTC GIOM
On the other hand, if Bitcoin price fails to move past $21,450 or roughly $21,500, it will indicate weak buying pressure. If this development knocks BTC lower and produces a daily candlestick close below the $19,000 level, it would invalidate the bullish outlook.
Such a development would invite panic sellers to offload their holdings, adding more selling pressure to the bunch and triggering a sell-off. This move could see Bitcoin price revisit the $15,500 support level.
Author

Akash Girimath
FXStreet
Akash Girimath is a Mechanical Engineer interested in the chaos of the financial markets. Trying to make sense of this convoluted yet fascinating space, he switched his engineering job to become a crypto reporter and analyst.



