Bitcoin 'bear trap' sees BTC price near $20K as daily gains top 9%

Bitcoin (BTC$19,595) delivered more surprises into Oct. 14 as the reaction to macro triggers saw a sudden run at $20,000.
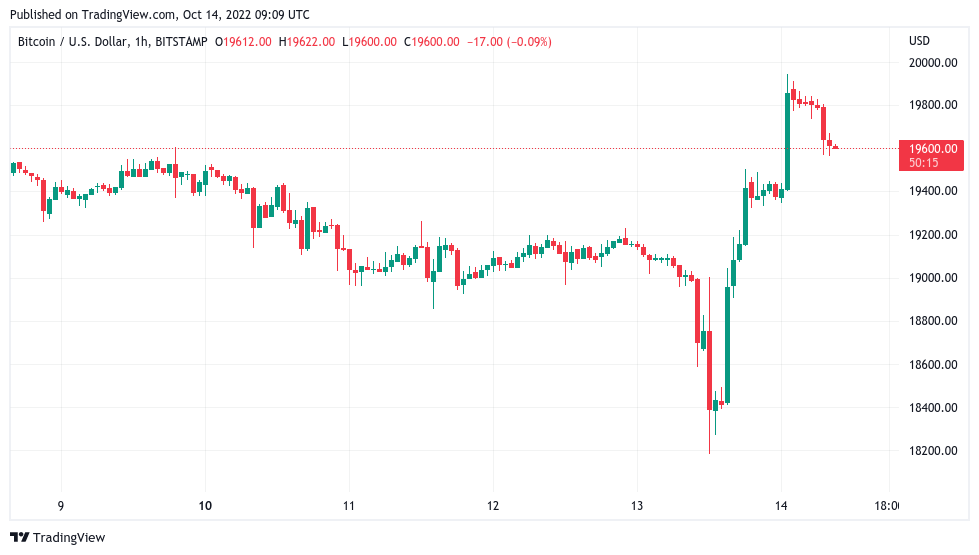
BTC/USD 1-hour candle chart (Bitstamp). Source: TradingView
Stocks, crypto smoke shorts
Data from Cointelegraph Markets Pro and TradingView showed BTC/USD climbing to one-week highs, gaining almost $2,000 in hours.
After the United States Consumer Price Index (CPI) print for September came in above expectations, an initial crypto rout put bulls on edge, but the pain was short lived.
Bitcoin ultimately ran higher than its pre-CPI levels, following stocks which were described as delivering the "biggest bear trap of 2022."
"That’s gotta be the biggest bear trap I’ve seen so far," popular Twitter trading account Stockrocker reacted.
Even I was starting to feel quite bearish.
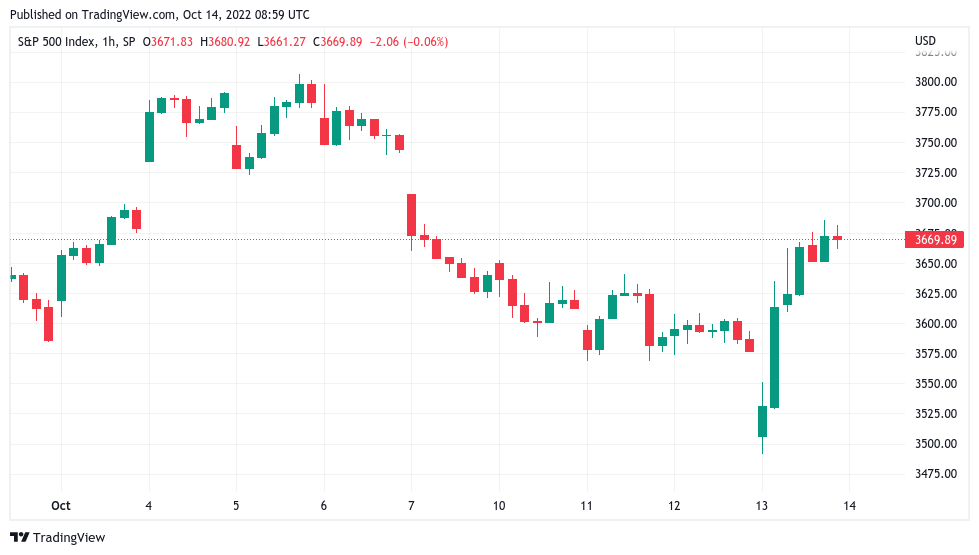
S&P 500 1-hour candle chart. Source: TradingView
Bitcoin thus kept volatility — and liquidations — coming as spot price bounced around an established trading range.
Popular Twitter analytics account On-Chain College noted that liquidations in a single hour on the day were the highest on those timeframes in over a month.
Data from monitoring resource Coinglass put total BTC liquidations at $116 million in the 24 hours to the time of writing. Cross-crypto liquidations totaled $327 million.
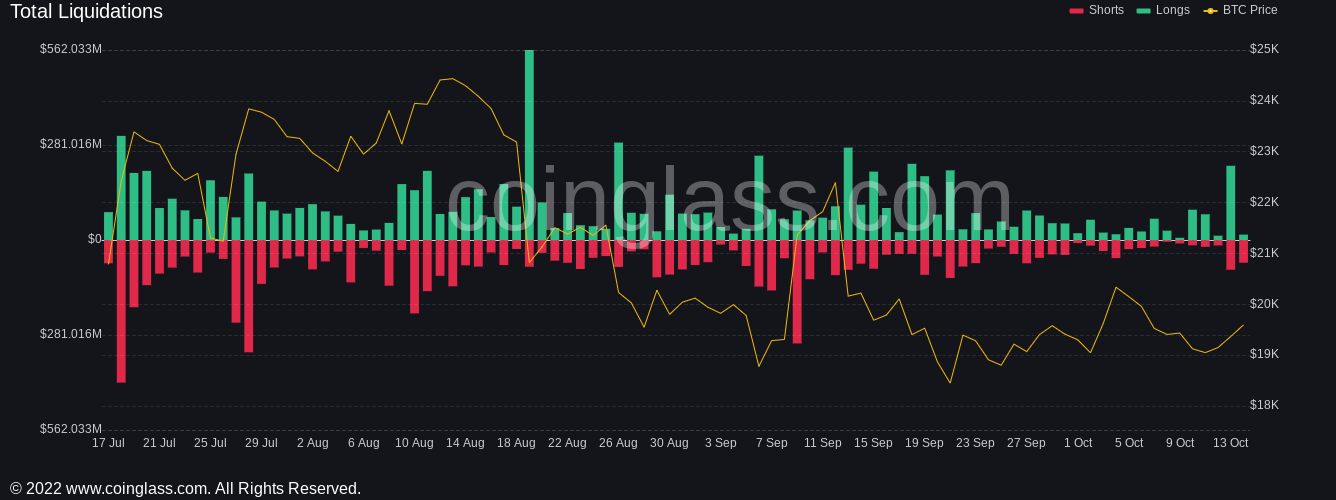
Crypto liquidations chart. Source: Coinglass
While failing to reclaim the $20,000 mark, Bitcoin was succeeding in flipping traders’ outlook to the bullish side.
Analyzing chart behavior stretching back to 2019, Credible Crypto argued that the signals were there for an extended upside breakout.
“Our last two major impulses were both preceded by around 120 days of relatively low-volatility consolidation before they began,” he summarized.
It's supposed to be boring- it's part of the process. The more boring it gets the better it is for the coming expansion.
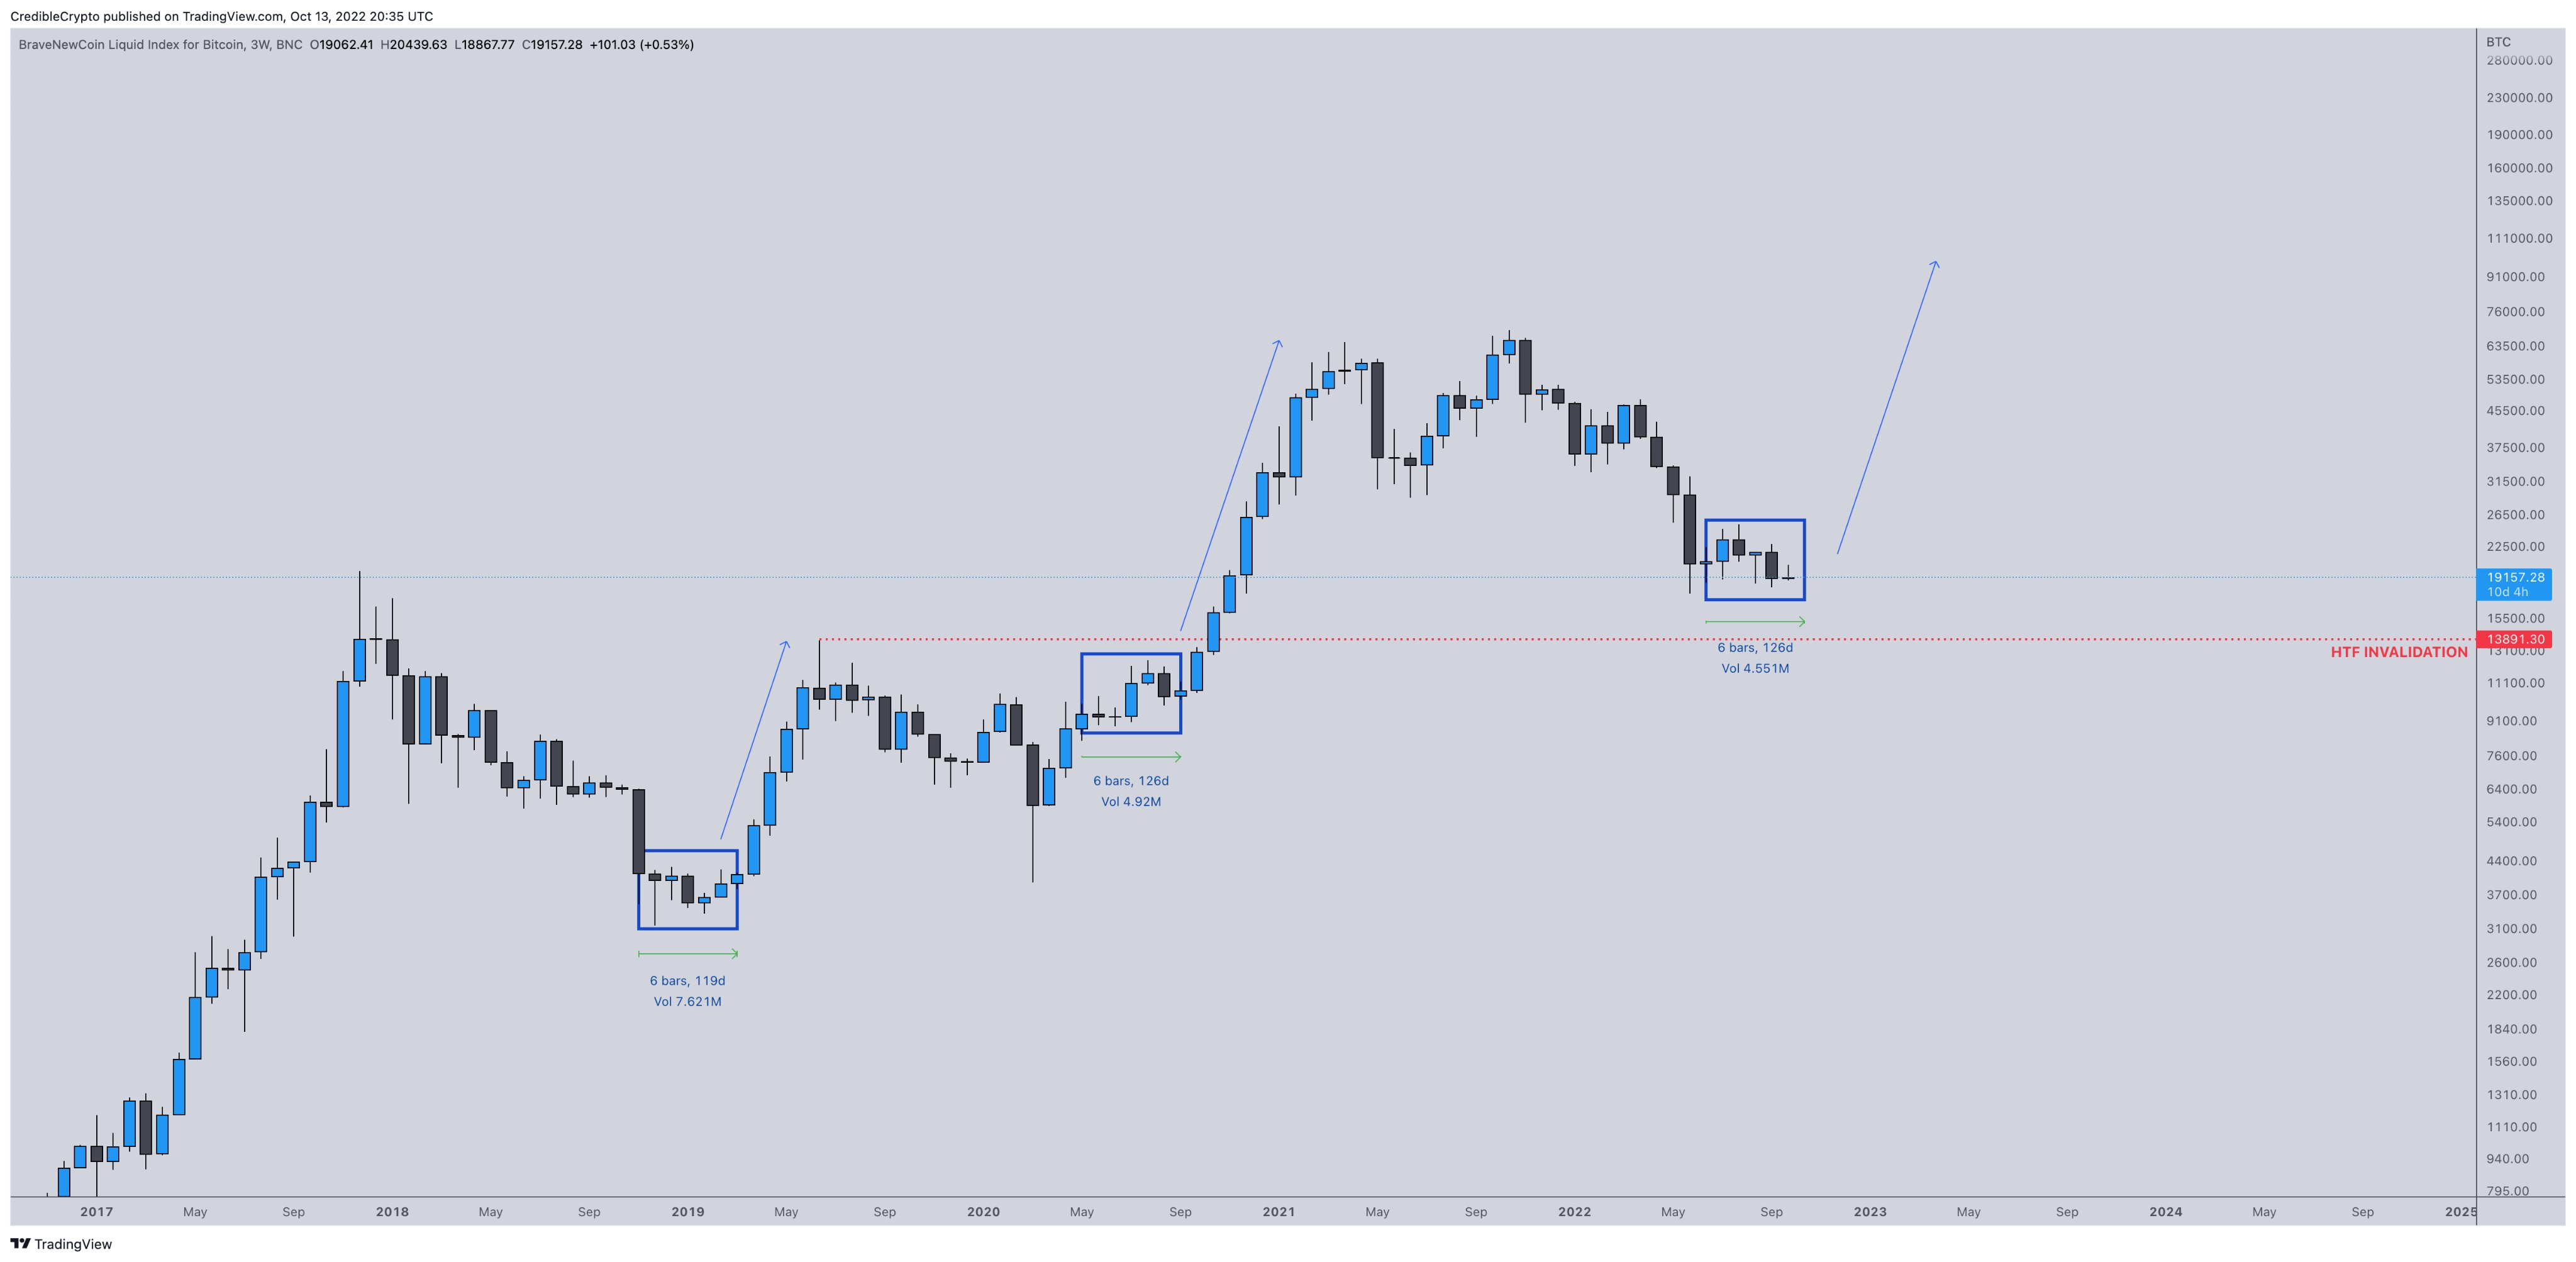
BTC/USD annotated chart. Source: Credible Crypto/ Twitter
Trader on future bottom: CPI move "isn't it"
Attention thus focused on whether markets could preserve the status quo at the end of the week.
In a sign of potential trouble brewing, the U.S. dollar index (DXY) began clawing back lost ground on the day in what could yet take the momentum out of the risk asset rally.
Summarizing the situation, popular trader Roman said that while it paid to be "macro bearish," there was no reason to ignore the signs of what should be a temporary relief rally.
"Yes I am macro bearish but this move down isn’t it," part of a Twitter thread read.
There’s bullish divergence on every higher timeframe and the DXY has bear divs. USDT.D rejected resistance as well. Tiny brained investors shorting the bottom yet again.
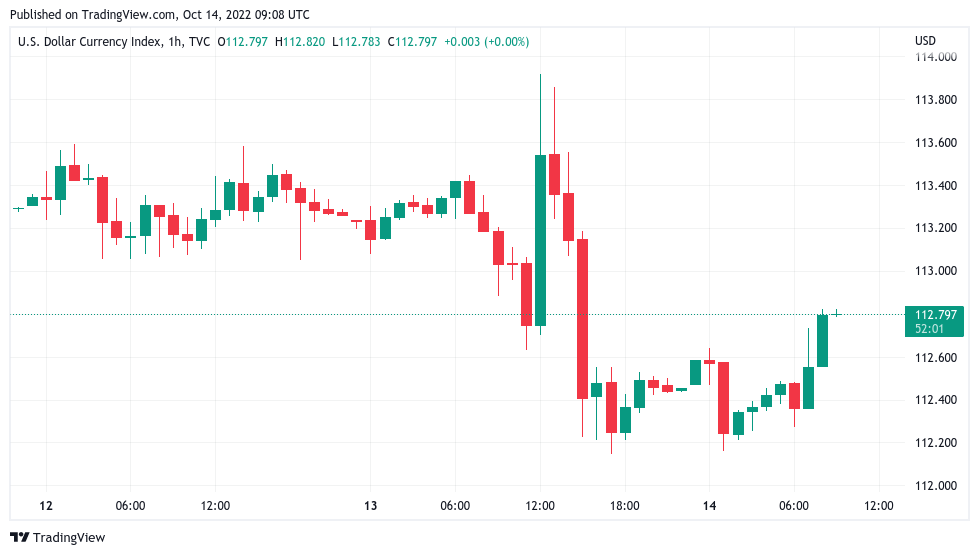
U.S. dollar index (DXY) 1-hour candle chart. Source: TradingView
Author

Cointelegraph Team
Cointelegraph
We are privileged enough to work with the best and brightest in Bitcoin.


