Bitcoin Weekly Forecast: Could BTC revisit $25,000 as ETF-induced hype dissipates?
- Bitcoin price barely holds the $30,000 psychological level after a sweep of the second-quarter high at $31,500.
- If the bearish divergence pattern matures, BTC could retest the $28,138 support level.
- The dire case scenario sees BTC tagging $25,000 and, in some cases, revisit the $24,267 support level.
- Invalidation of this bearish outlook can occur if the big crypto holds above $32,308 and skyrockets to strike the $35,260 hurdle.

Bitcoin (BTC) price shows multiple sell signals on the daily chart, hinting at a short-term correction. Although the longer-term outlook remains bullish, the hype generated by multiple US-based companies filing for Bitcoin ETF seems to be waning. The decline in investor-frenzy coupled with short-term traders booking profits could be the main driver of the incoming sell-off.
Also read: Bitcoin price stalls at $31,500, putting short-term BTC trader gains in jeopardy
Bitcoin price and its bearish daily timeframe
Bitcoin (BTC) price shows an evident bearish divergence. This setup contains BTC producing a higher high while the Relative Strength Index (RSI) sets up a lower high. The non-conformity eventually leads to a decline in the underlying asset’s market value.
For Bitcoin price, investors can notice the April 14 and July 3 higher highs as the larger bearish divergence or the June 23 and July 3 higher highs. For both instances, not only the RSI but also the Awesome Oscillator (AO) has produced lower highs.
A continuation of the selling pressure could send Bitcoin price down to the initial support level around the $28,000 level. Failing to hold above this barrier would lead BTC down to the Momentum Reversal Indicator’s (MRI) State Trend Resistance level at $25,142, denoted in green dots. This barrier coincides closely with the $24,267 support level, which was a key hurdle to overcome between July 2022 and March 2023.
Therefore, a retest of $24,267 would likely catalyze buying pressure from sidelined investors and potentially create a local bottom.
Read more: Week Ahead: Buy the dip or sit on your hands?
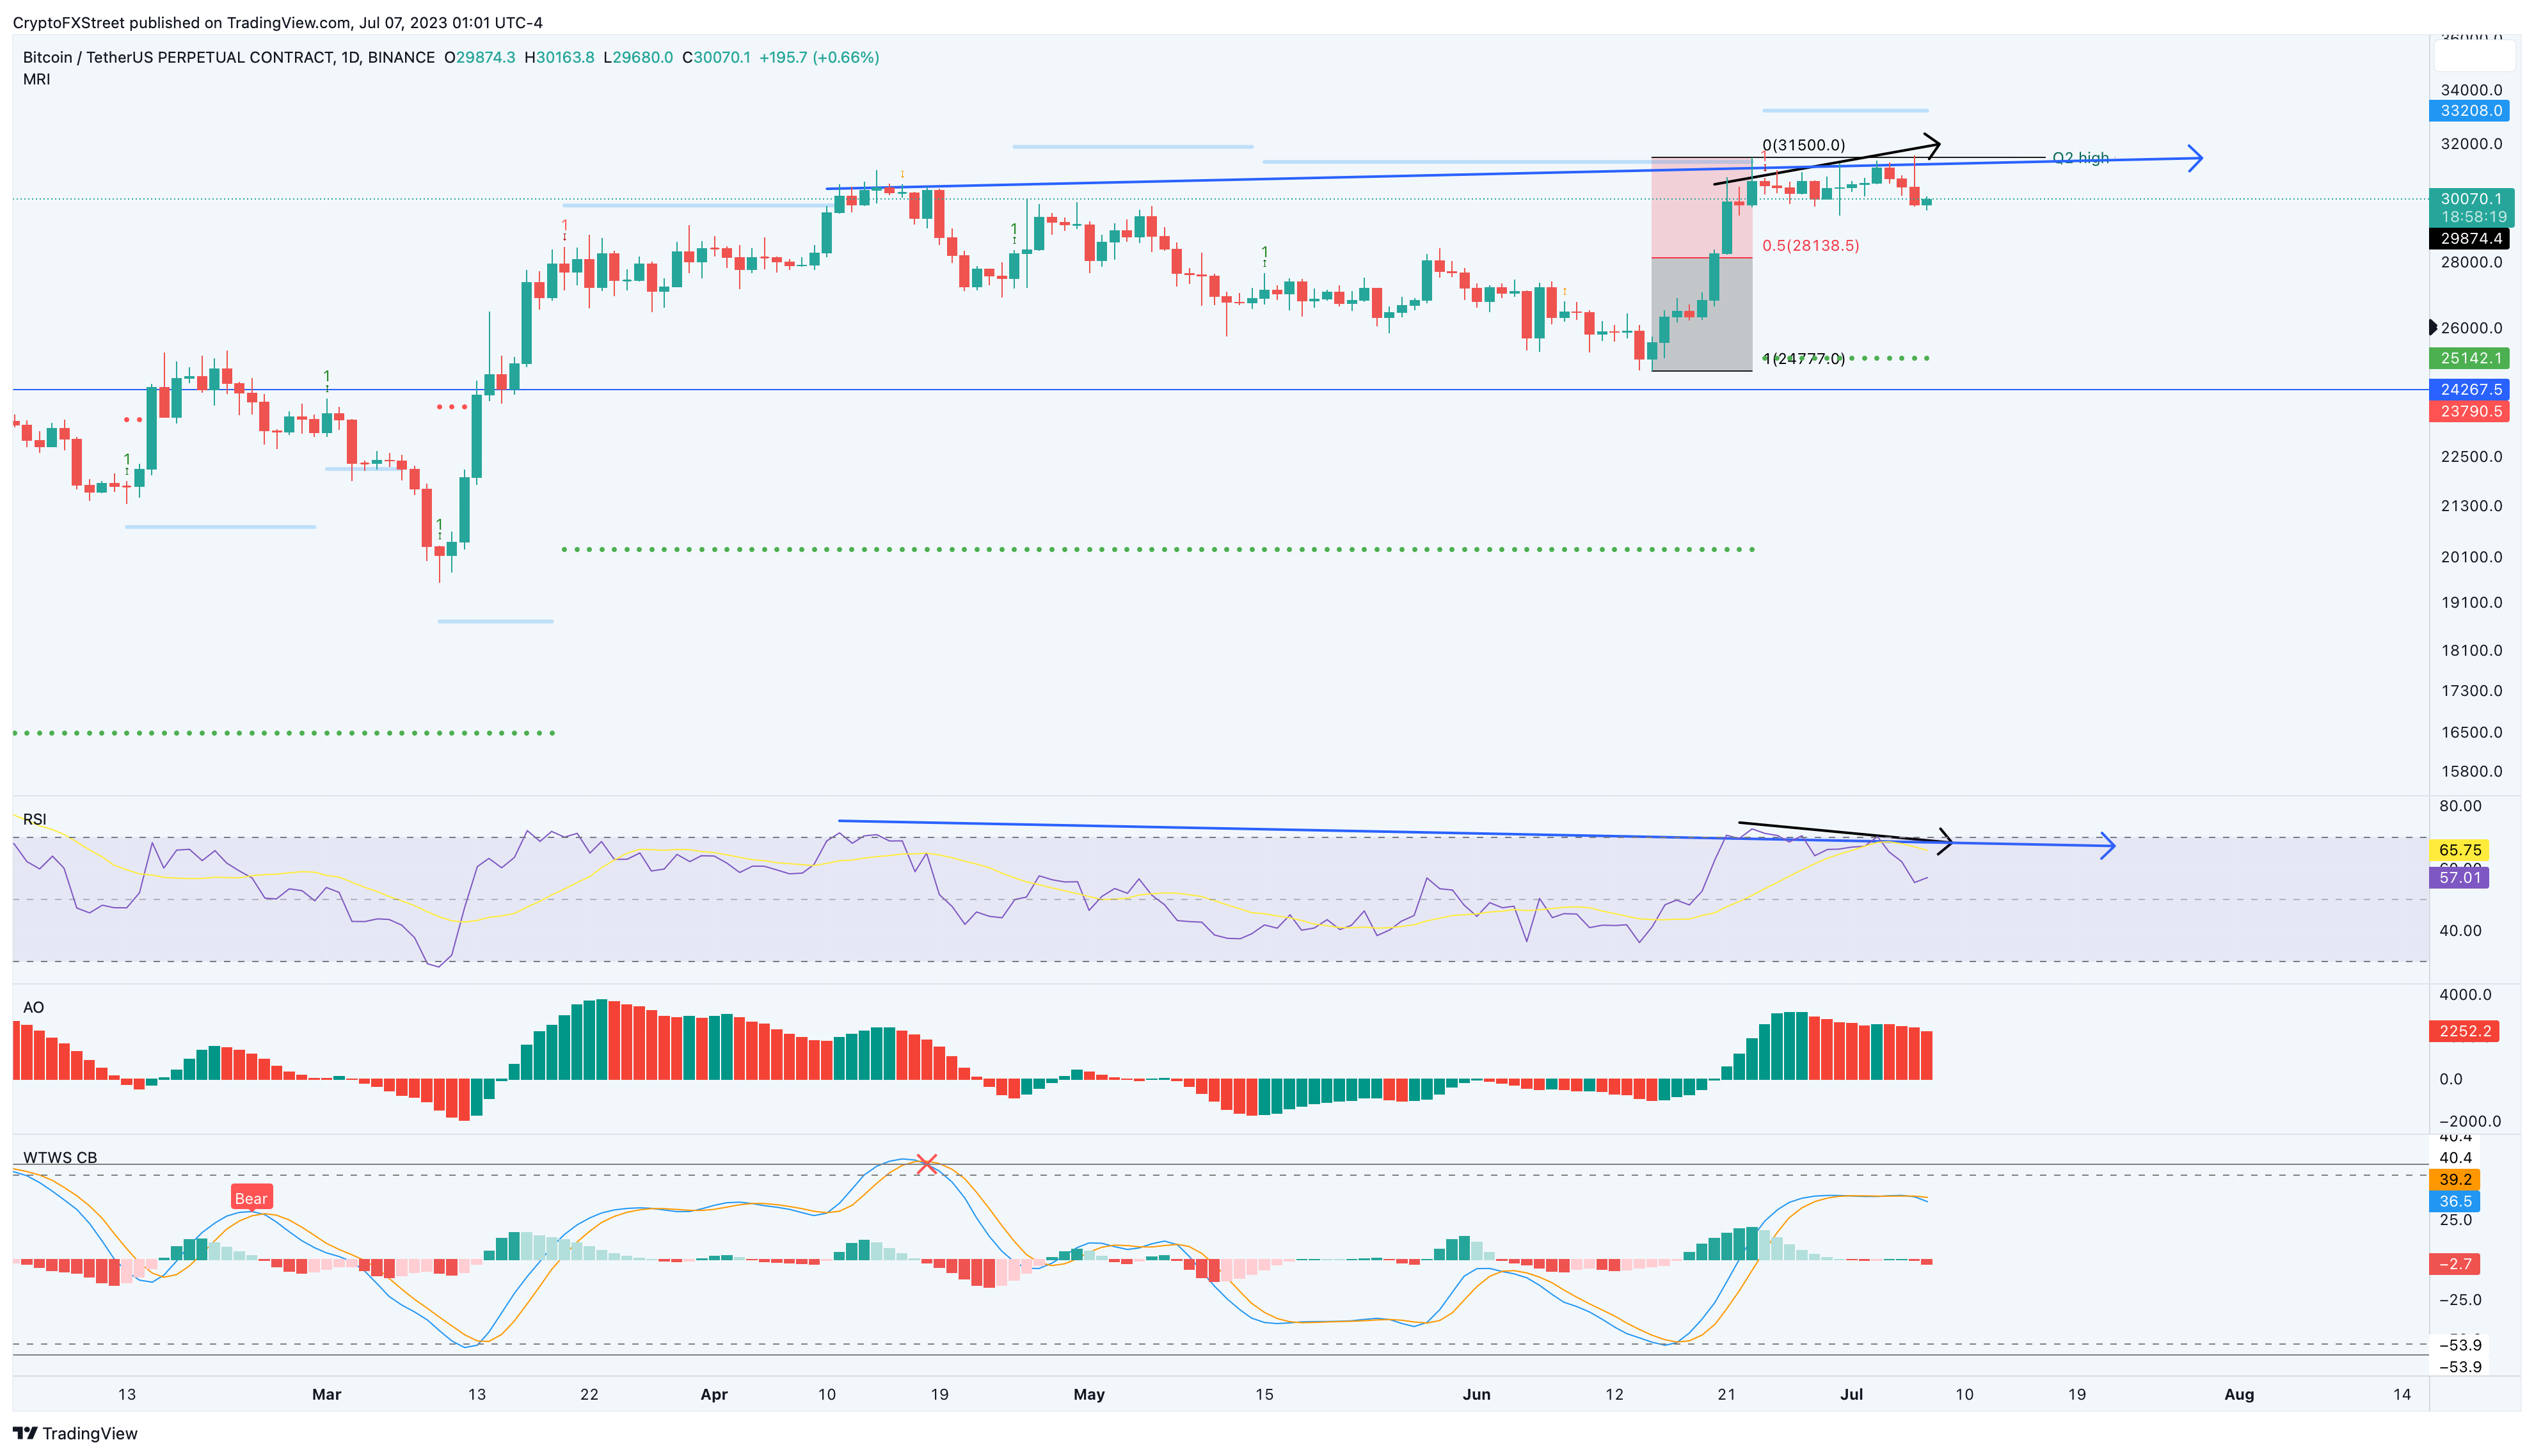
BTC/USDT 1-day chart
For a longer-term outlook on Bitcoin price, read this: Three reasons why Bitcoin’s 2023 rally is just starting
On the other hand, if Bitcoin (BTC) price consolidates around $30,000 and collects enough momentum to shoot through the selling pressure at $31,500, it would denote a resurgence of buyers.
In such a case, if Bitcoin price shatters through the MRI’s Risk Line at $32,308, it would invalidate the bearish thesis. This development could see BTC retest the $35,260 hurdle.
Like this article? Help us with some feedback by answering this survey:
Author

Akash Girimath
FXStreet
Akash Girimath is a Mechanical Engineer interested in the chaos of the financial markets. Trying to make sense of this convoluted yet fascinating space, he switched his engineering job to become a crypto reporter and analyst.


