Bitcoin Weekly Forecast: Can XRP’s win take BTC to $40,000?
- Bitcoin price sweeps second quarter’s high at $31,500 and sets up a new high at $31,845 after Ripple’s victory.
- Investors have turned optimistic, causing BTC and altcoins to rally simultaneously.
- Long-term on-chain metrics continue to hint that the big picture remains bullish.

Bitcoin (BTC) price got a respite from sideways trading after the United States Securities and Exchange Commission (SEC) vs. Ripple lawsuit reached a conclusion, for now. The announcement caused Ripple (XRP) price to double in a few hours, causing other altcoins to also rally from the hype. BTC was no exception as it ended its 23-day consolidation and swept the second quarter high at $31,500.
More Ripple news
SEC responds to Court’s ruling about XRP not being a security
XLM price skyrockets nearly 100%, enjoys passive gains from XRP win in the SEC vs. Ripple lawsuit
XRP naysayers miss out on 70% gains after Ripple Labs and SEC share joint victory
Bitcoin price shows signs of revival
Bitcoin price shows that the bulls are back, at least for now. But ‘will the buyers remain optimistic as the XRP hype dissipates?’ is the question that remains. Regardless, let us take a look at the three-day chart of BTC to determine where it will head next.
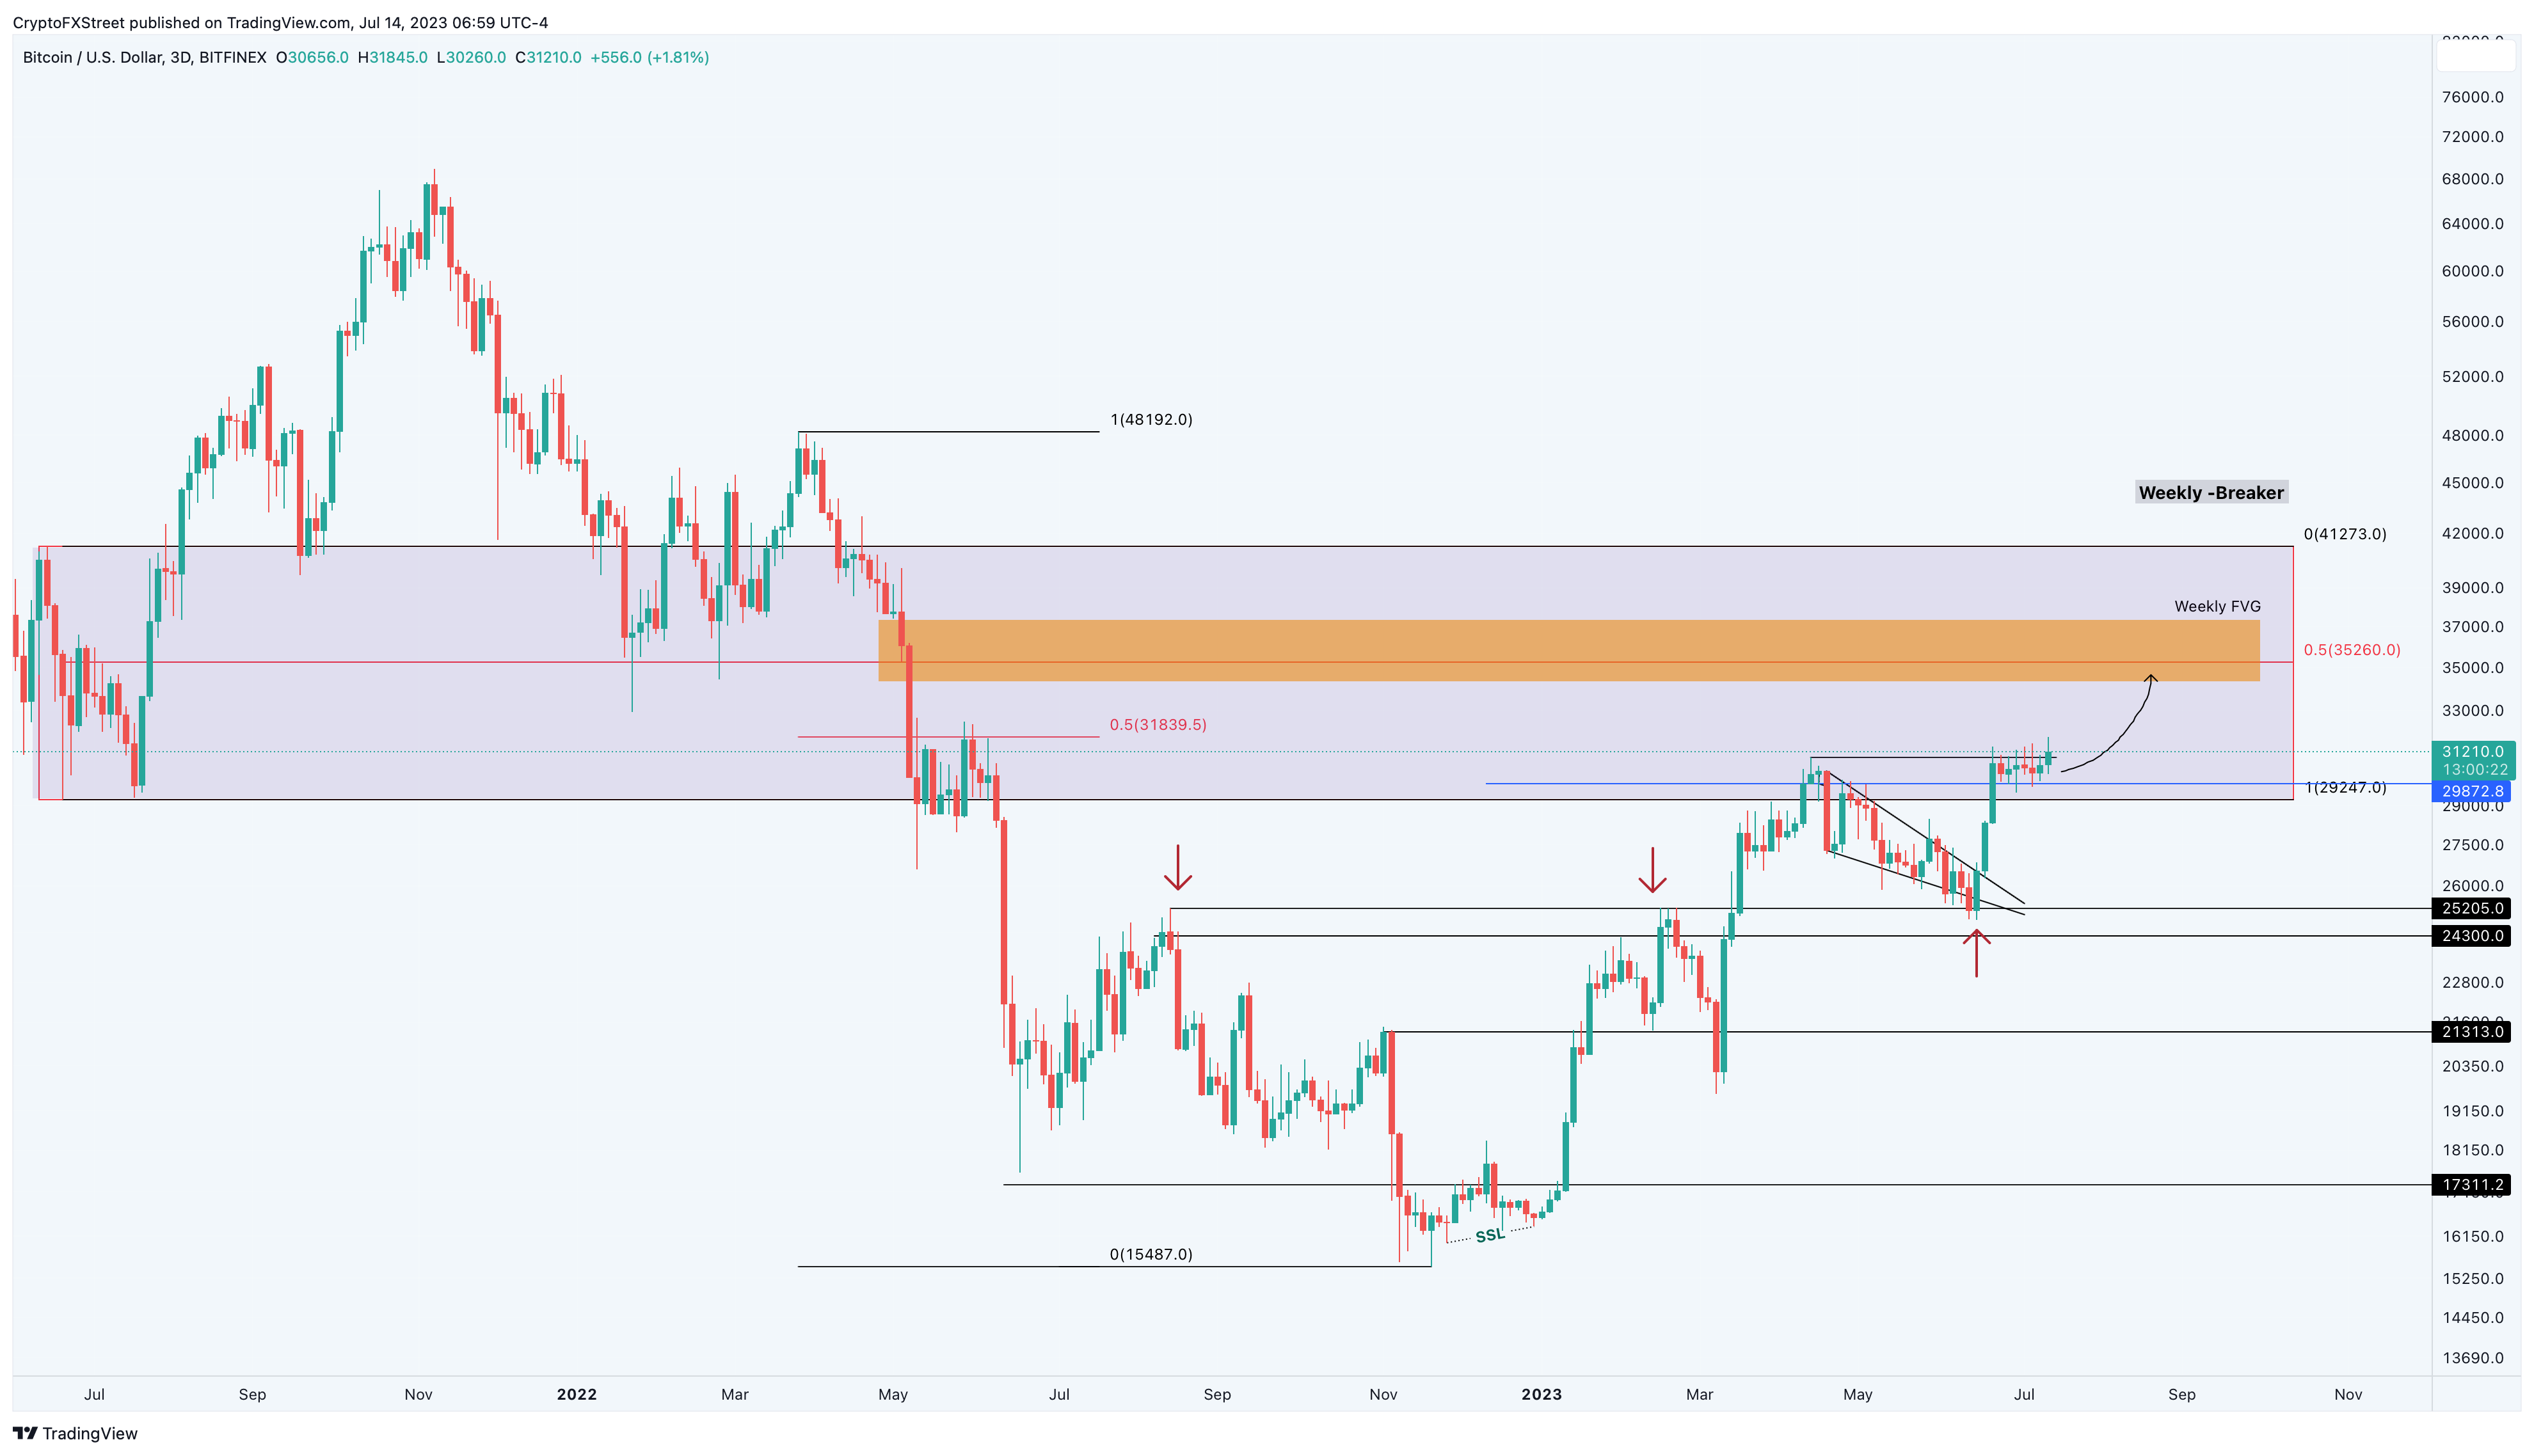
Not a lot has changed on the three-day chart for Bitcoin price; the weekly bearish breaker, extending from $29,247 and $41,273, still poses a threat to bulls. The upside targets at $35,260 and $41,273 are the midpoint and the upper limit of the bearish breaker and are good take-profit levels for bulls.
The aforementioned barriers are places where bears could attempt a coup and retake control. But if Bitcoin price decisively flips the $40,000 psychological level on the weekly timeframe, it would be an extremely bullish development that could revitalize the 2023 rally. A bearish breaker is formed when the last down candlestick(s) formed between two higher highs are breached to the downside and flipped into hurdles. A subsequent pullback would lead to trapped holders selling their holdings, triggering a bearish move.
Read more on Bearish Breaker
BTC/USDT 3-day chart
On-chain metrics remain bullish
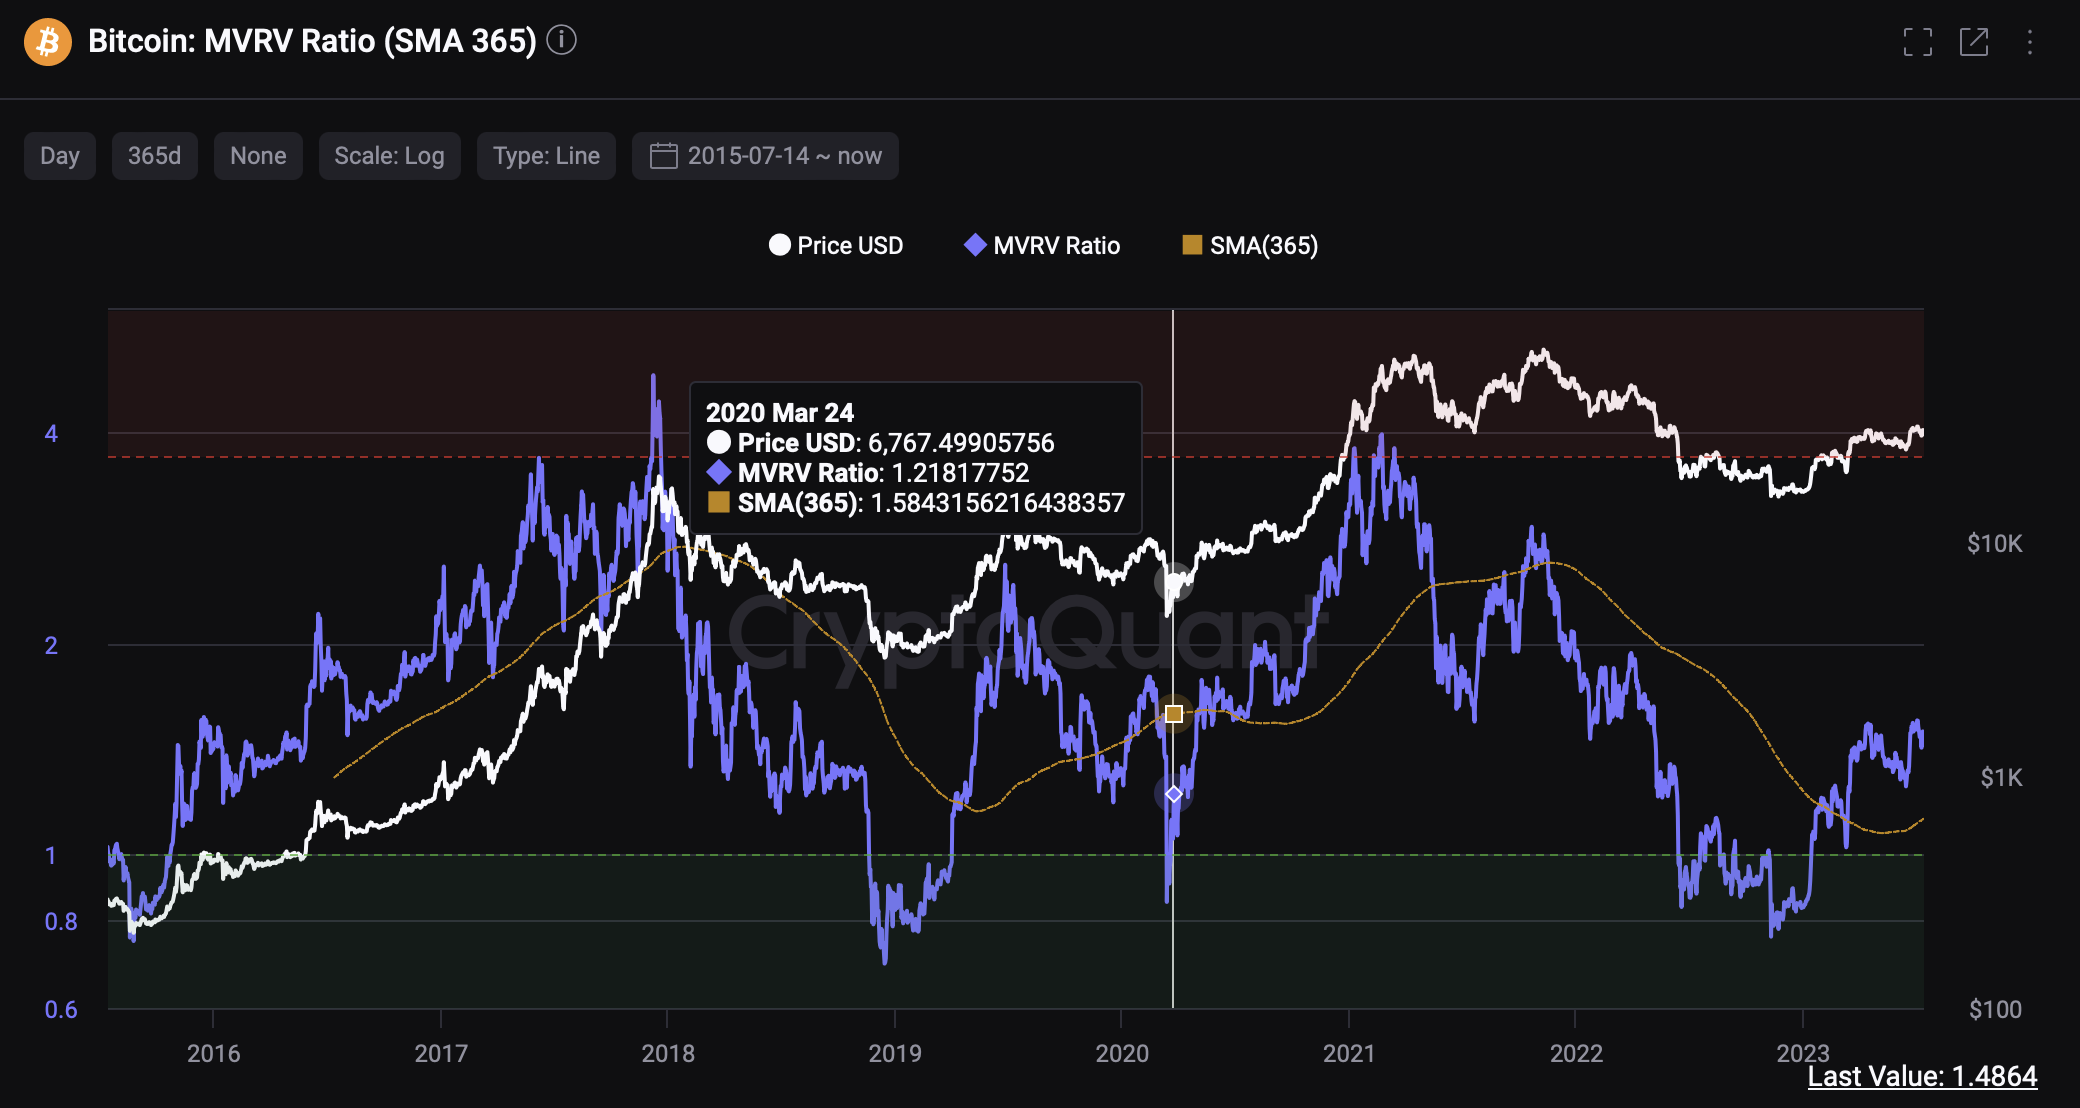
The 365-day Market Value to Realized Value (MVRV) metric with a 365-day Moving Average (MA) shows that Bitcoin price is closer to observing a new bull cycle. This indicator is used to measure the average profit and loss of investors that purchased BTC over the past year.
When this indicator is above 3.7, i.e., in the red band, the asset is considered overbought and is typically when the market forms tops. Likewise, if the 365-day MVRV is below 1, it indicates that Bitcoin price is forming a potential bottom and that a reversal in trend is likely.
So far, the MVRV ratio has dipped in the green band and has bounced off to 1.48, where it currently sits and hints that the new uptrend might be in motion.
BTC 365-day MVRV
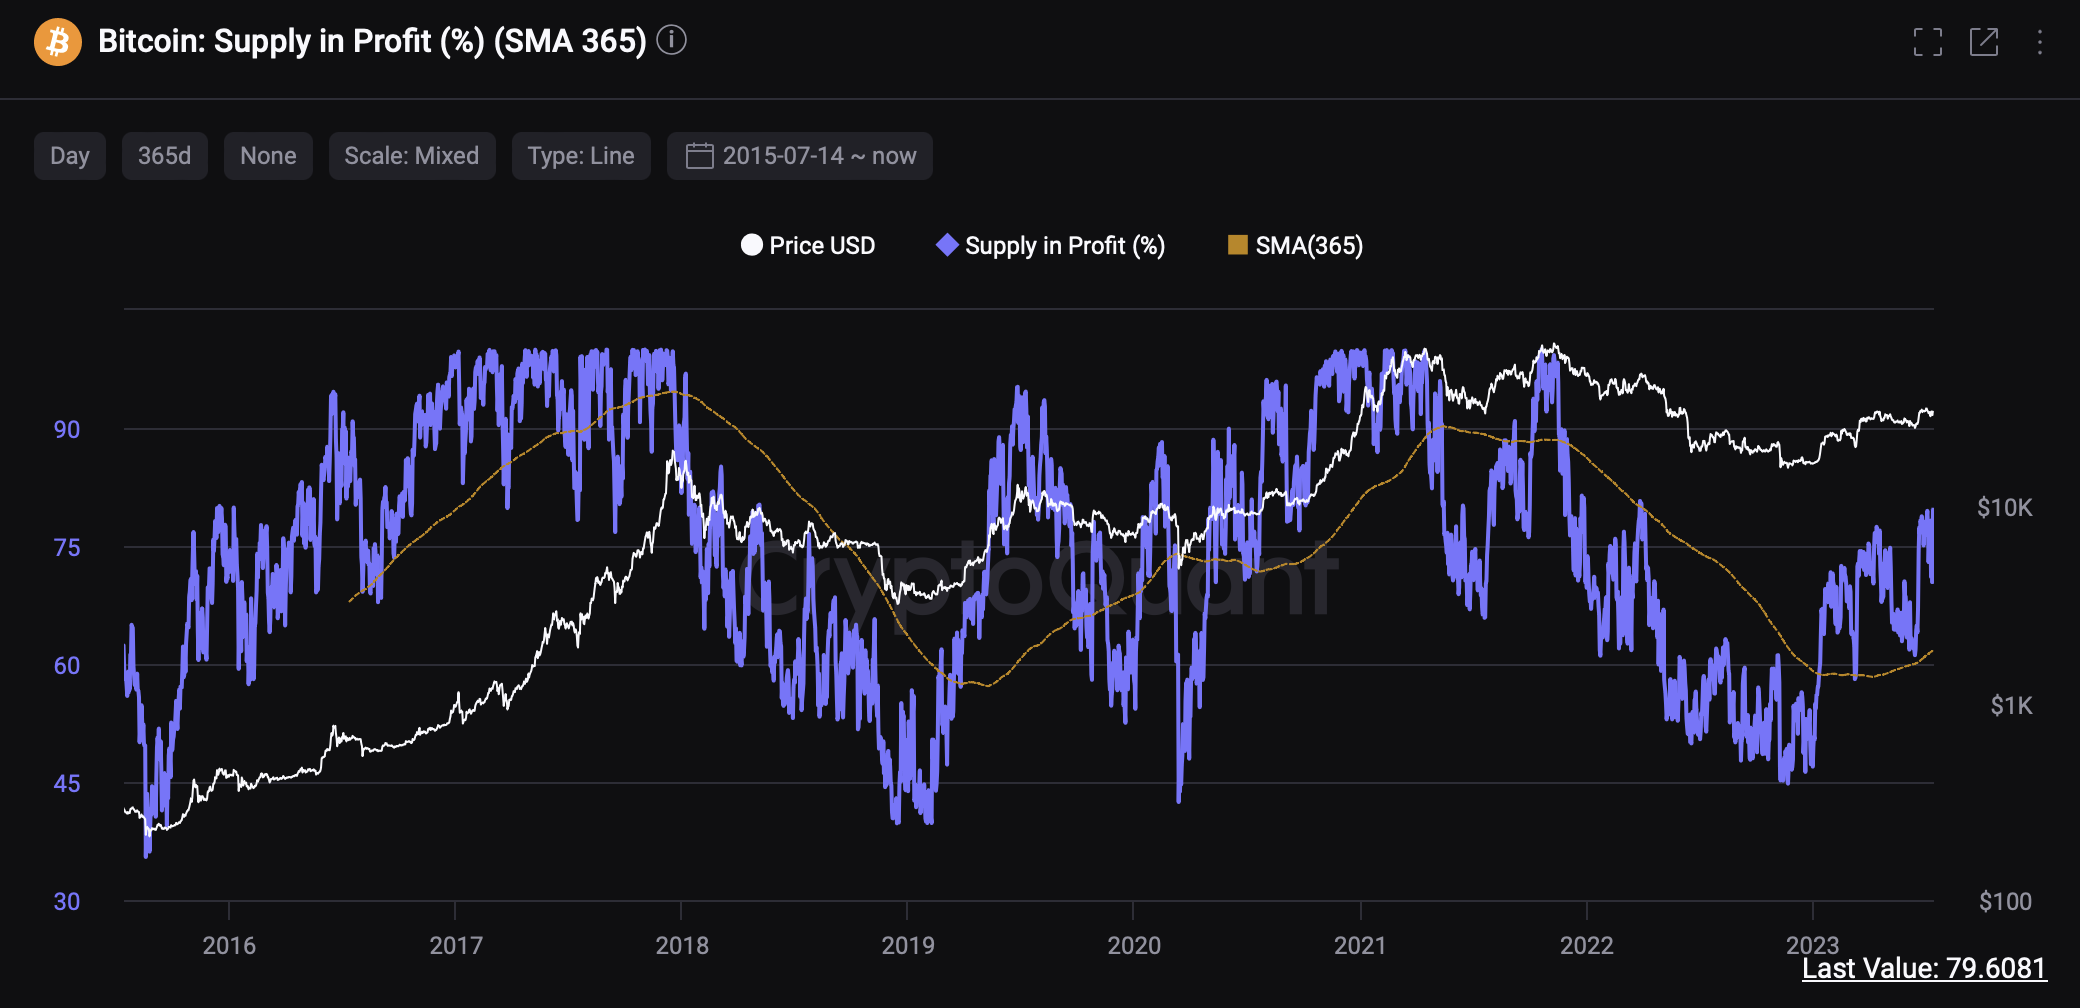
The next important metric to look at is the total percentage of Bitcoin’s supply in profit. From a historical perspective, market or cycle bottoms are formed when this indicator displays 45% or less. Currently, the indicator reads nearly 79%. The last time such a huge number of investors were in profit was in May 2022.
BTC percentage of supply in profit
While the outlook for Bitcoin price remains largely bullish on the high timescale, investors need to note that Ripple’s win against the United States Securities and Exchange Commission (SEC) is a short-lived hype.
If investors come together and book profits, it could undo the recent gains and kickstart a nosedive. If BTC shatters the $29,872 from its current position at $31,200, it will invalidate the bullish thesis. Such a development could induce a 15.72% crash to the $25,205 support level.
Author

Akash Girimath
FXStreet
Akash Girimath is a Mechanical Engineer interested in the chaos of the financial markets. Trying to make sense of this convoluted yet fascinating space, he switched his engineering job to become a crypto reporter and analyst.


