Bitcoin Weekly Forecast: Can BTC bears challenge crypto’s 2023 bull rally?
- Bitcoin price is trading at $26,776 after sliding nearly 5% in the last five days.
- The weekly chart shows the struggle between bulls and bears to seize control.
- The daily time frame paints a bullish picture for BTC and suggests a potential outlook for a quick rally.

Bitcoin (BTC) price is at a critical juncture in the weekly time frame, where bulls and bears are battling for control. However, a multi-time-frame analysis shows that BTC is bullish daily and is likely to rally higher.
Also read: Bitcoin likely to pull back after another failed breakout, CPI beats expectations at 3.7%
Bitcoin price structure remains intact on weekly chart
Bitcoin (BTC) price, on the weekly time frame, has produced multiple higher highs and higher lows in 2023, showcasing its bull run. This uptrending market faces a challenge as BTC attempted to breach June’s key low at $25,941. Although there was a weekly candlestick close below this level, bears failed to follow through, which is why this move was a failed breakout. As a result of the bears’ no-show, BTC bulls took control and produced a potential local top at $28,592.
From the looks of it, there are two temporary conclusions one can draw and why traders get caught in the wrong direction.
- If $28,592 is a local top, then the next move should produce a decisive weekly close below $25,941.
- But if bulls are still in control, Bitcoin price should continue its rally and produce a higher high than the July high of $30,616.
In the case of the first outcome, history suggests that breaching a key low could trigger a volatile move that could extend anywhere from 20% to 60%. The 2021 and 2022 time frames have examples of these events unfolding.
On the contrary, for bulls to remain in control, they need to produce a higher high above $30,616, which could prompt an attempt to retest and overcome the 2021 weekly low at $31,777.
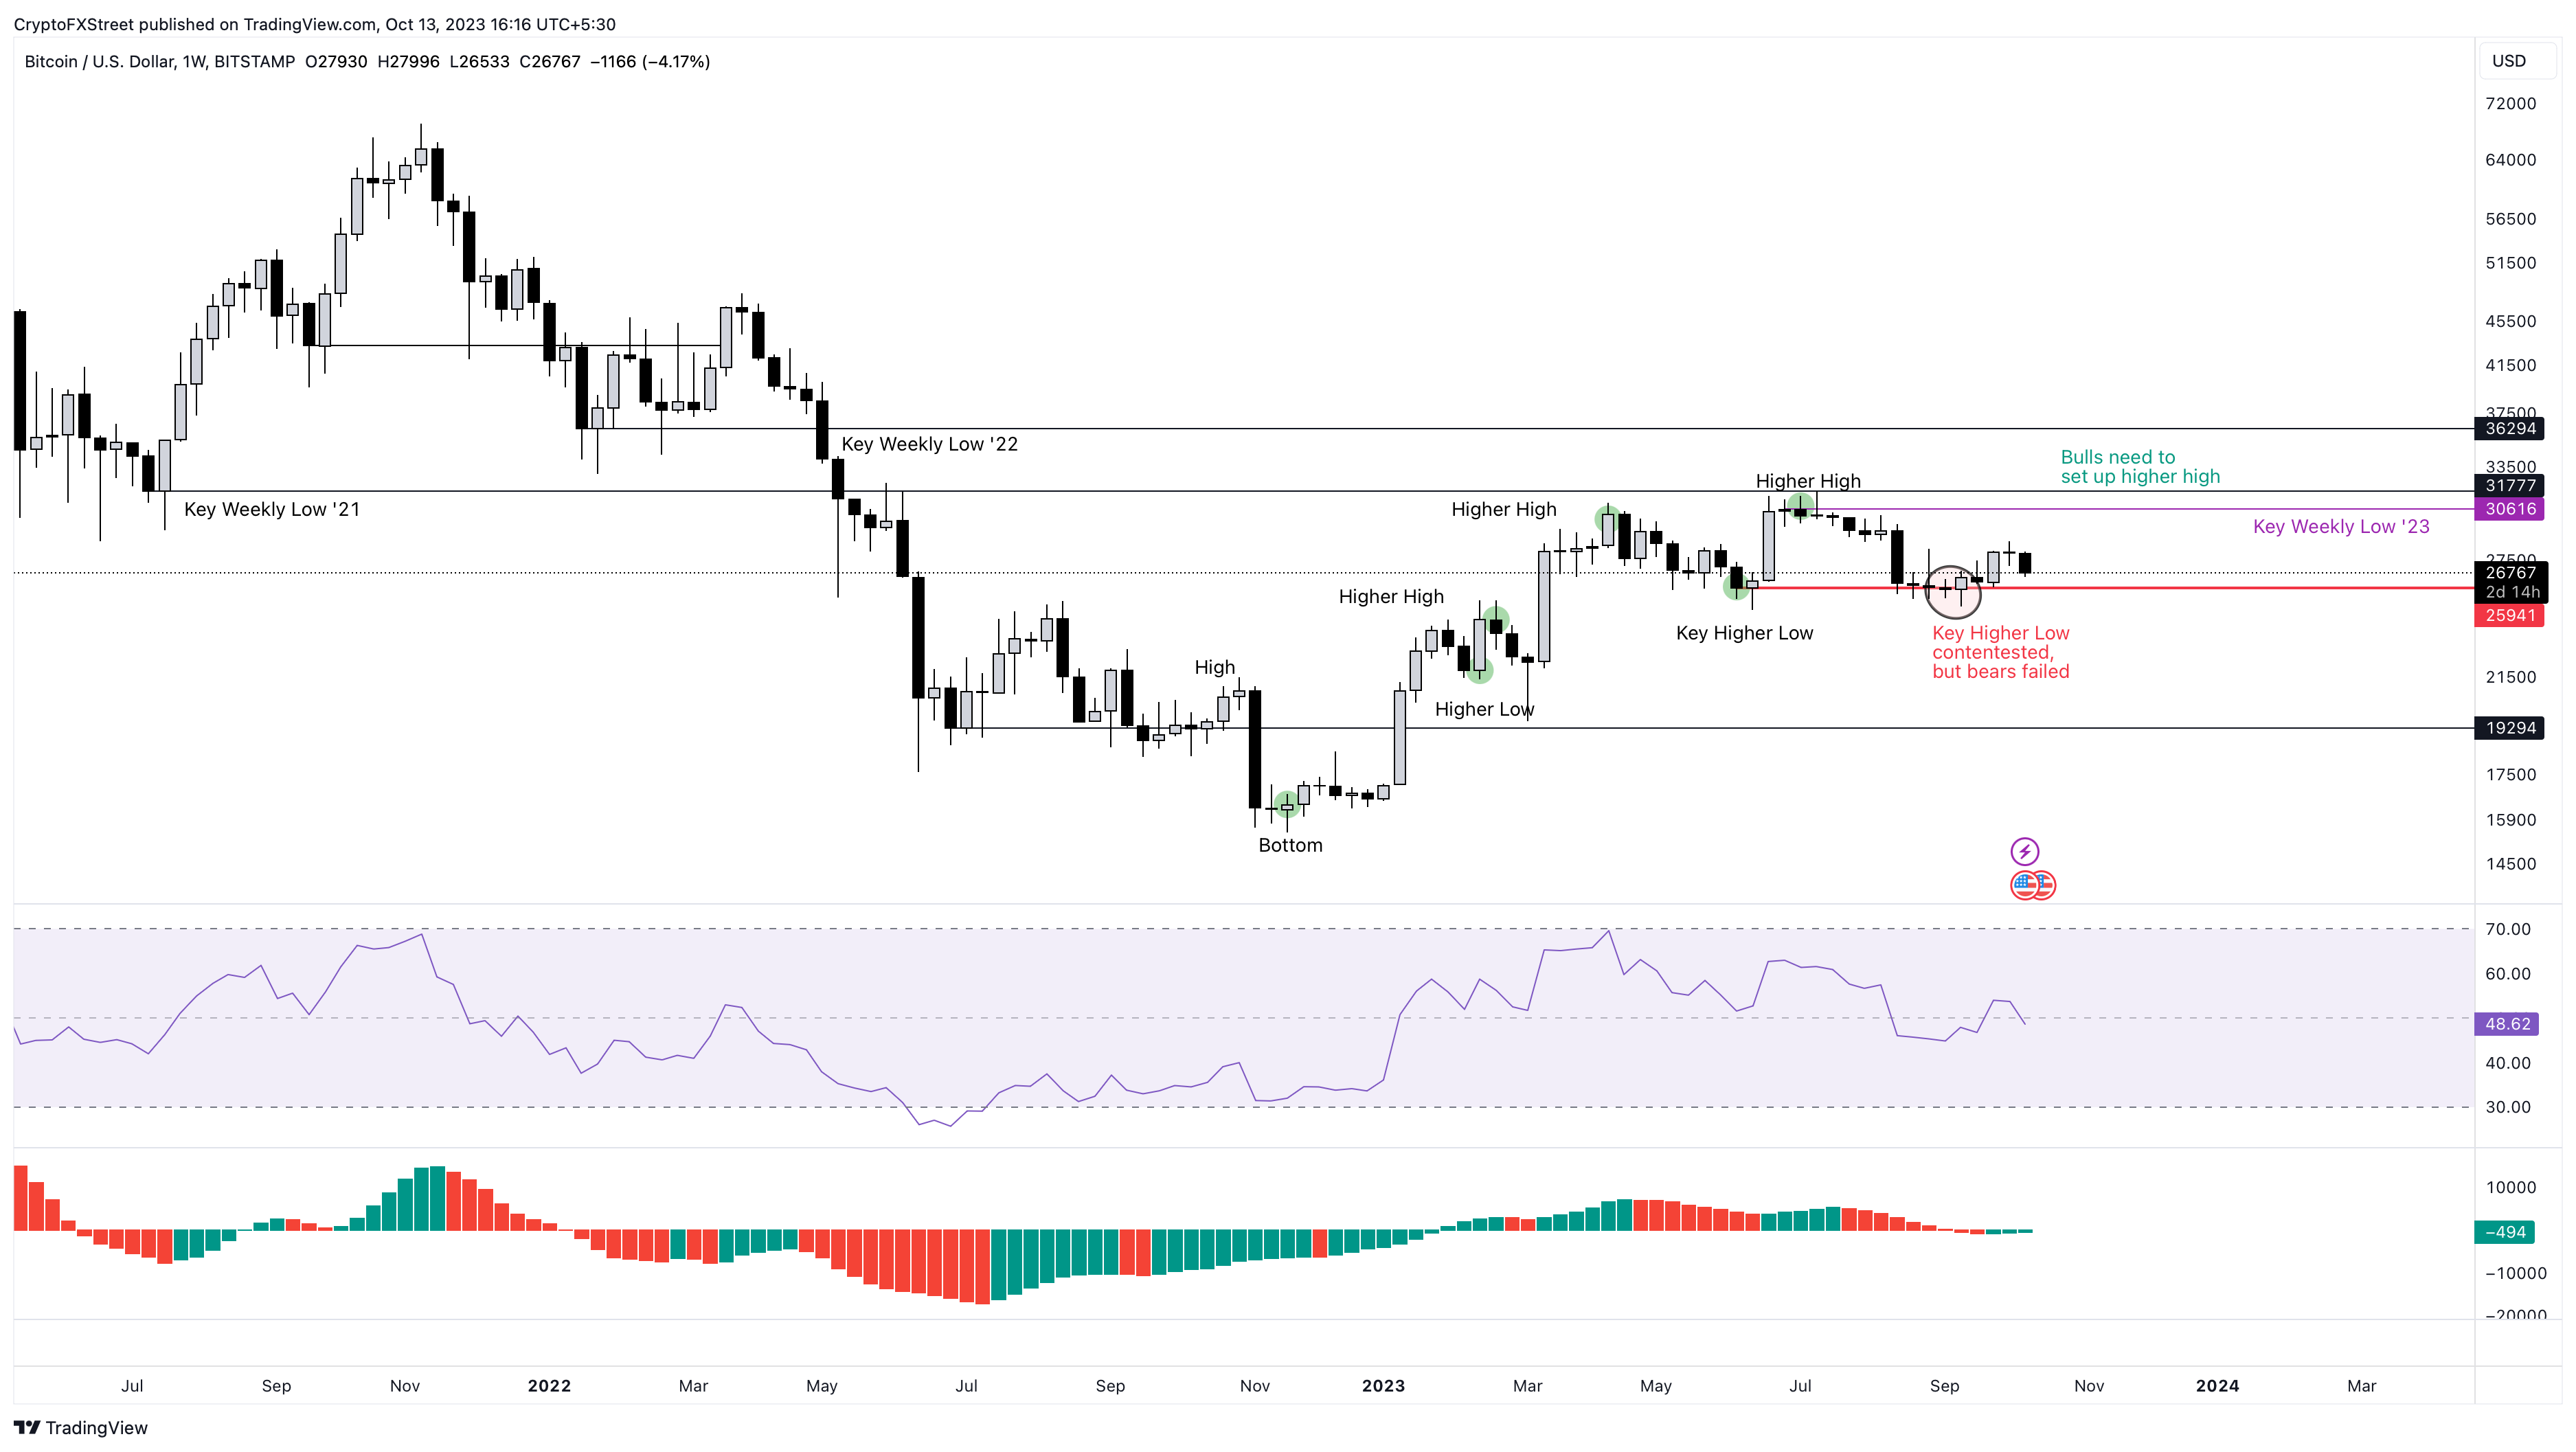
BTC/USDT 1-week chart
Which outlook will come first? And how can traders position themselves?
To answer this question, a lower time frame analysis is needed.
BTC’s daily chart notes key developments
Bitcoin (BTC) price action on the daily chart shows that the failed attempt to breach the weekly level of $25,941 was followed by a minor uptrend. Over the last month, BTC has produced three higher lows and two higher highs and currently trades at $26,783.
Hence, the next few weeks are critical to see if BTC does rally higher or not.
As seen in the chart, Bitcoin price slipped below the $26,500 support level in the last week of September. During this failed bearish attempt, the Relative Strength Index (RSI) breached the 50 briefly, and the Awesome Oscillator (AO) came close to flipping below the zero level. But a quick recovery pushed both the RSI and AO to rise higher.
Now, Bitcoin price has fallen under the $27,400 support level, pushing RSI below 50 and AO close to the zero level. If history were to repeat itself, investors can expect a quick recovery above the immediate hurdle at $27,400 and attempt to produce a higher high above the October 2 high at $27,992.
If successful, BTC bulls could carry the move up to $30,000.
Also read: Bitcoin holders get clean slate; Will BTC price choose $30,000 or $25,000?
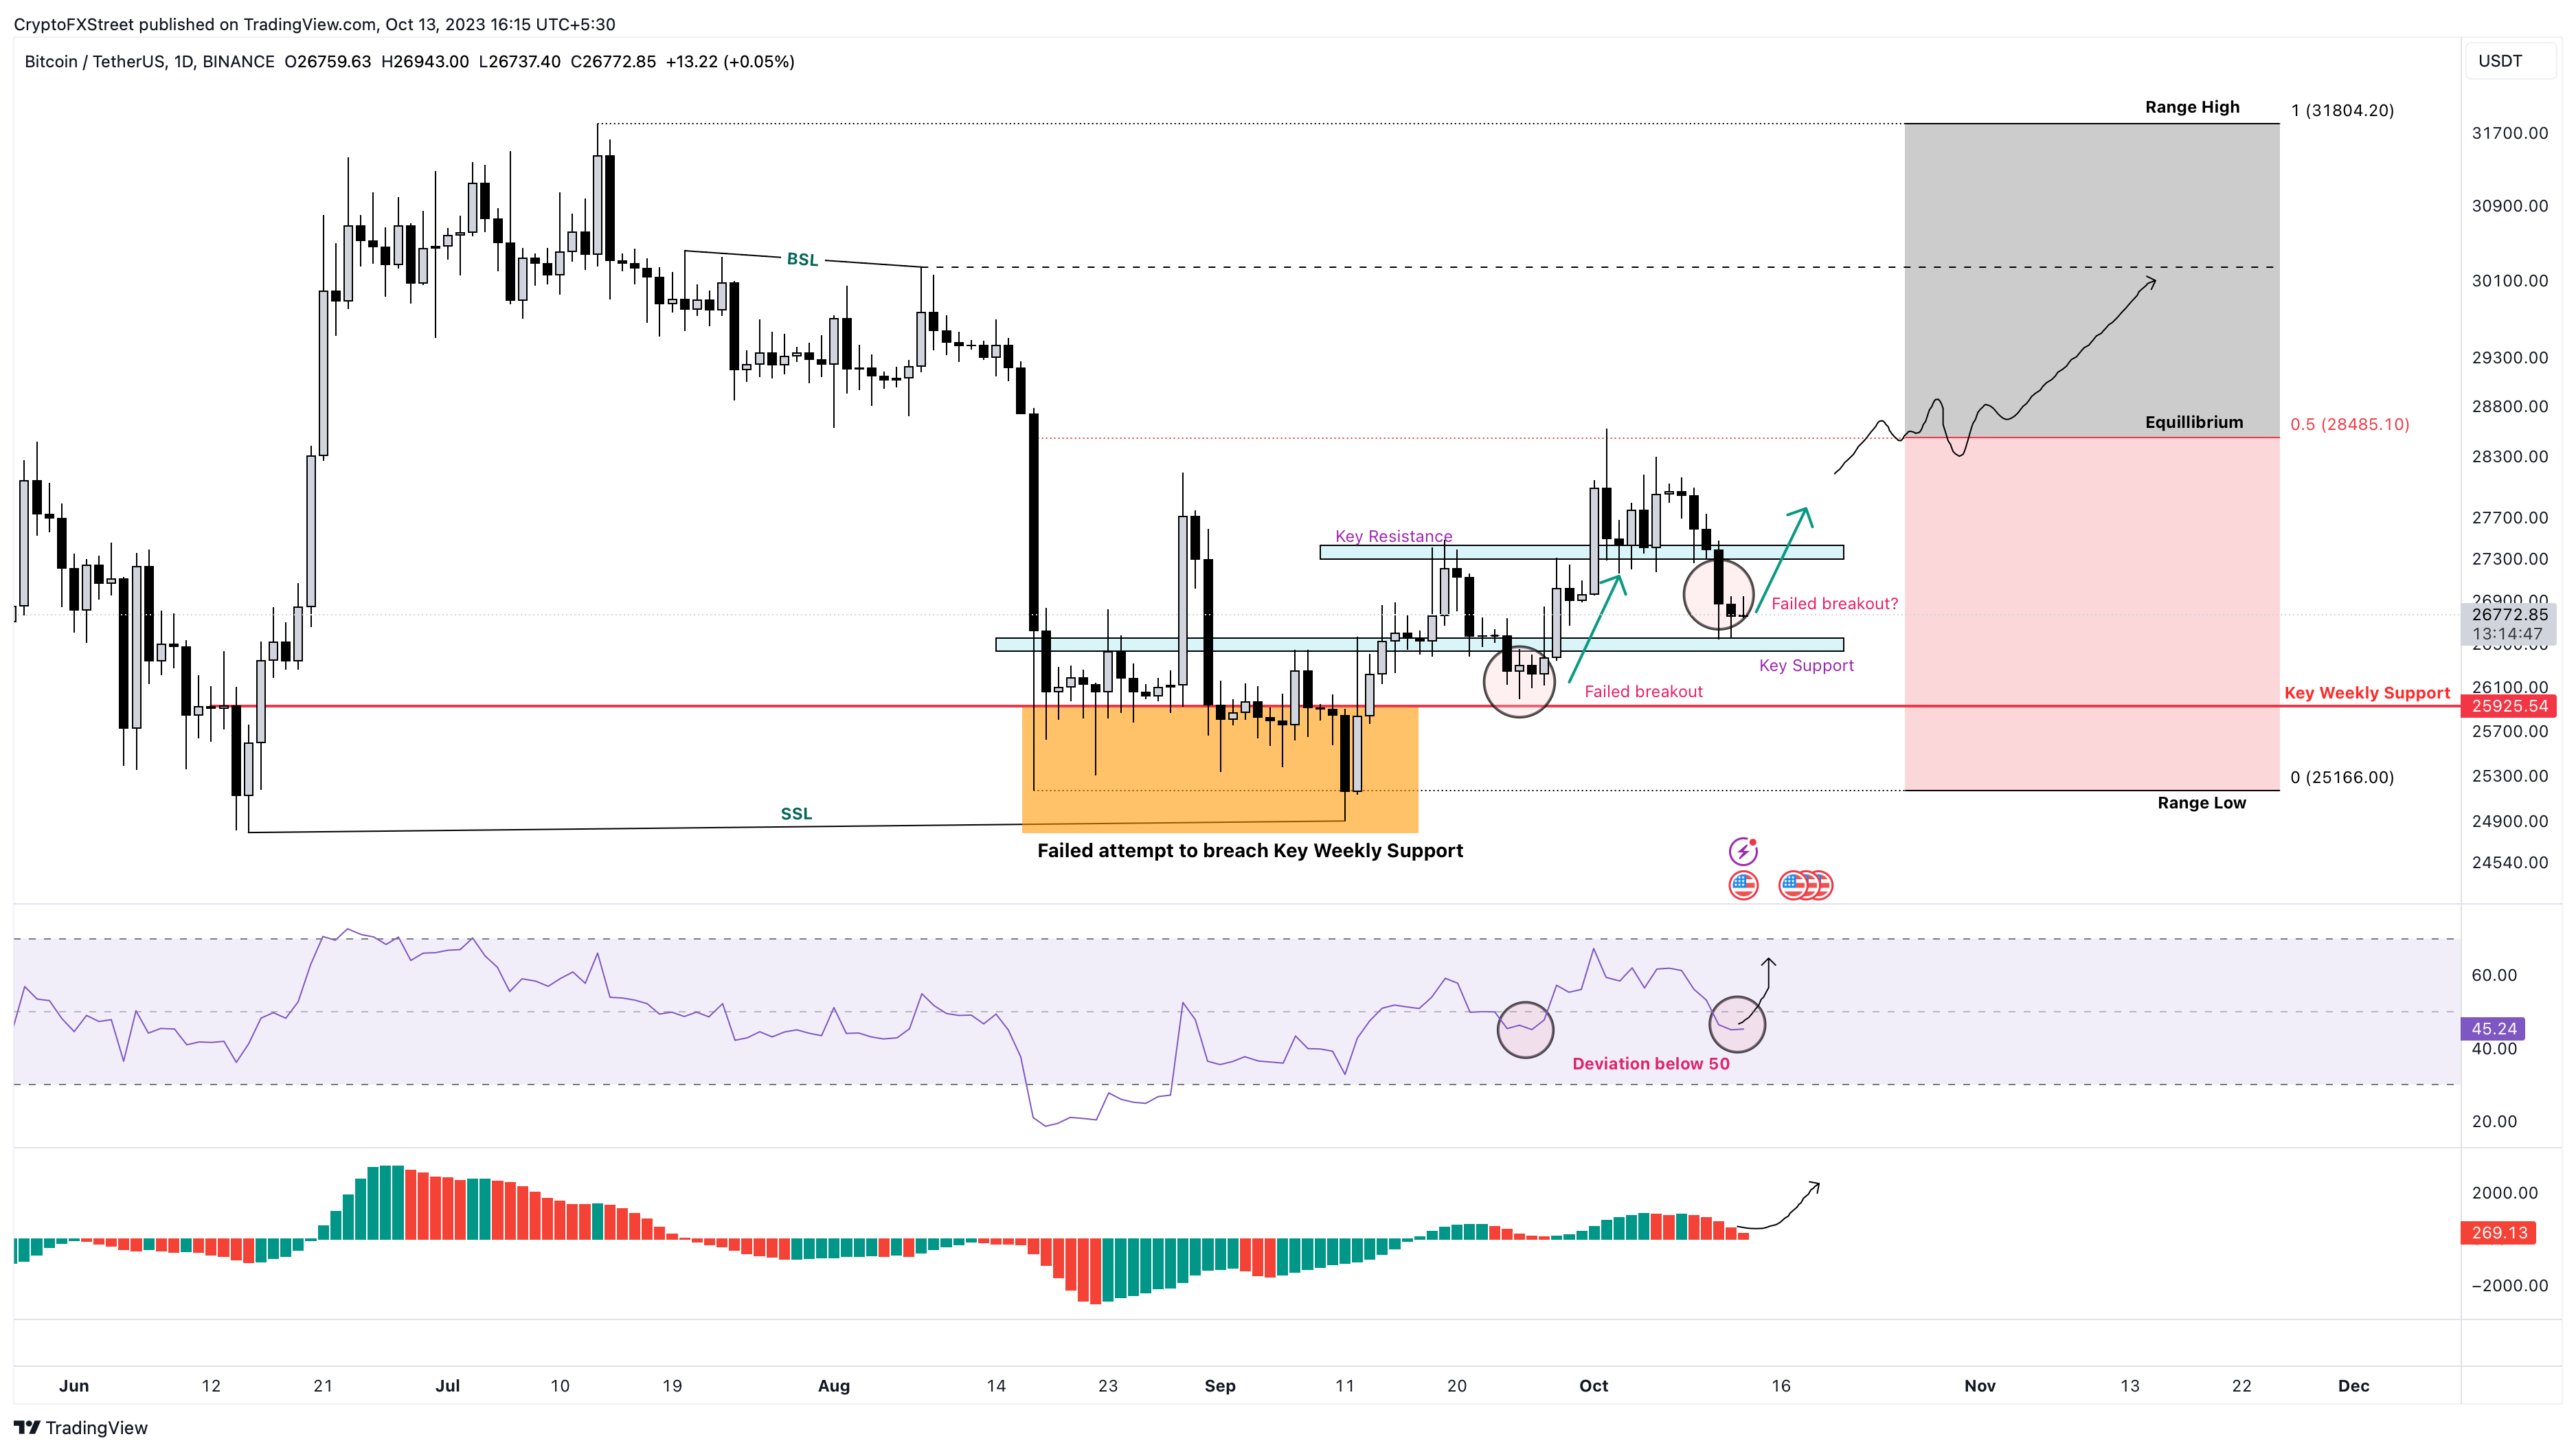
BTC/USDT 1-day chart
While the outlook for Bitcoin price on the weekly looks tempting for short sellers, they need to be patient. For investors looking to buy the dip, the $25,900 support level needs to be held on the daily time frame.
For bulls to remain in control of the 2023 bull market rally, Bitcoin price needs to edge up and produce a decisive weekly candlestick close above $30,616.
Read more: What needs to happen for BTC 2023 bull rally to continue? [Video]
Author

Akash Girimath
FXStreet
Akash Girimath is a Mechanical Engineer interested in the chaos of the financial markets. Trying to make sense of this convoluted yet fascinating space, he switched his engineering job to become a crypto reporter and analyst.


