Bitcoin likely to pull back after another failed breakout, CPI beats expectations at 3.7%
- Bitcoin price has dropped almost 5% this week, inspiring a wave of bearish sentiment across the market.
- Santiment's mid-term trends shows CPI, inflation and bear market searches are trending.
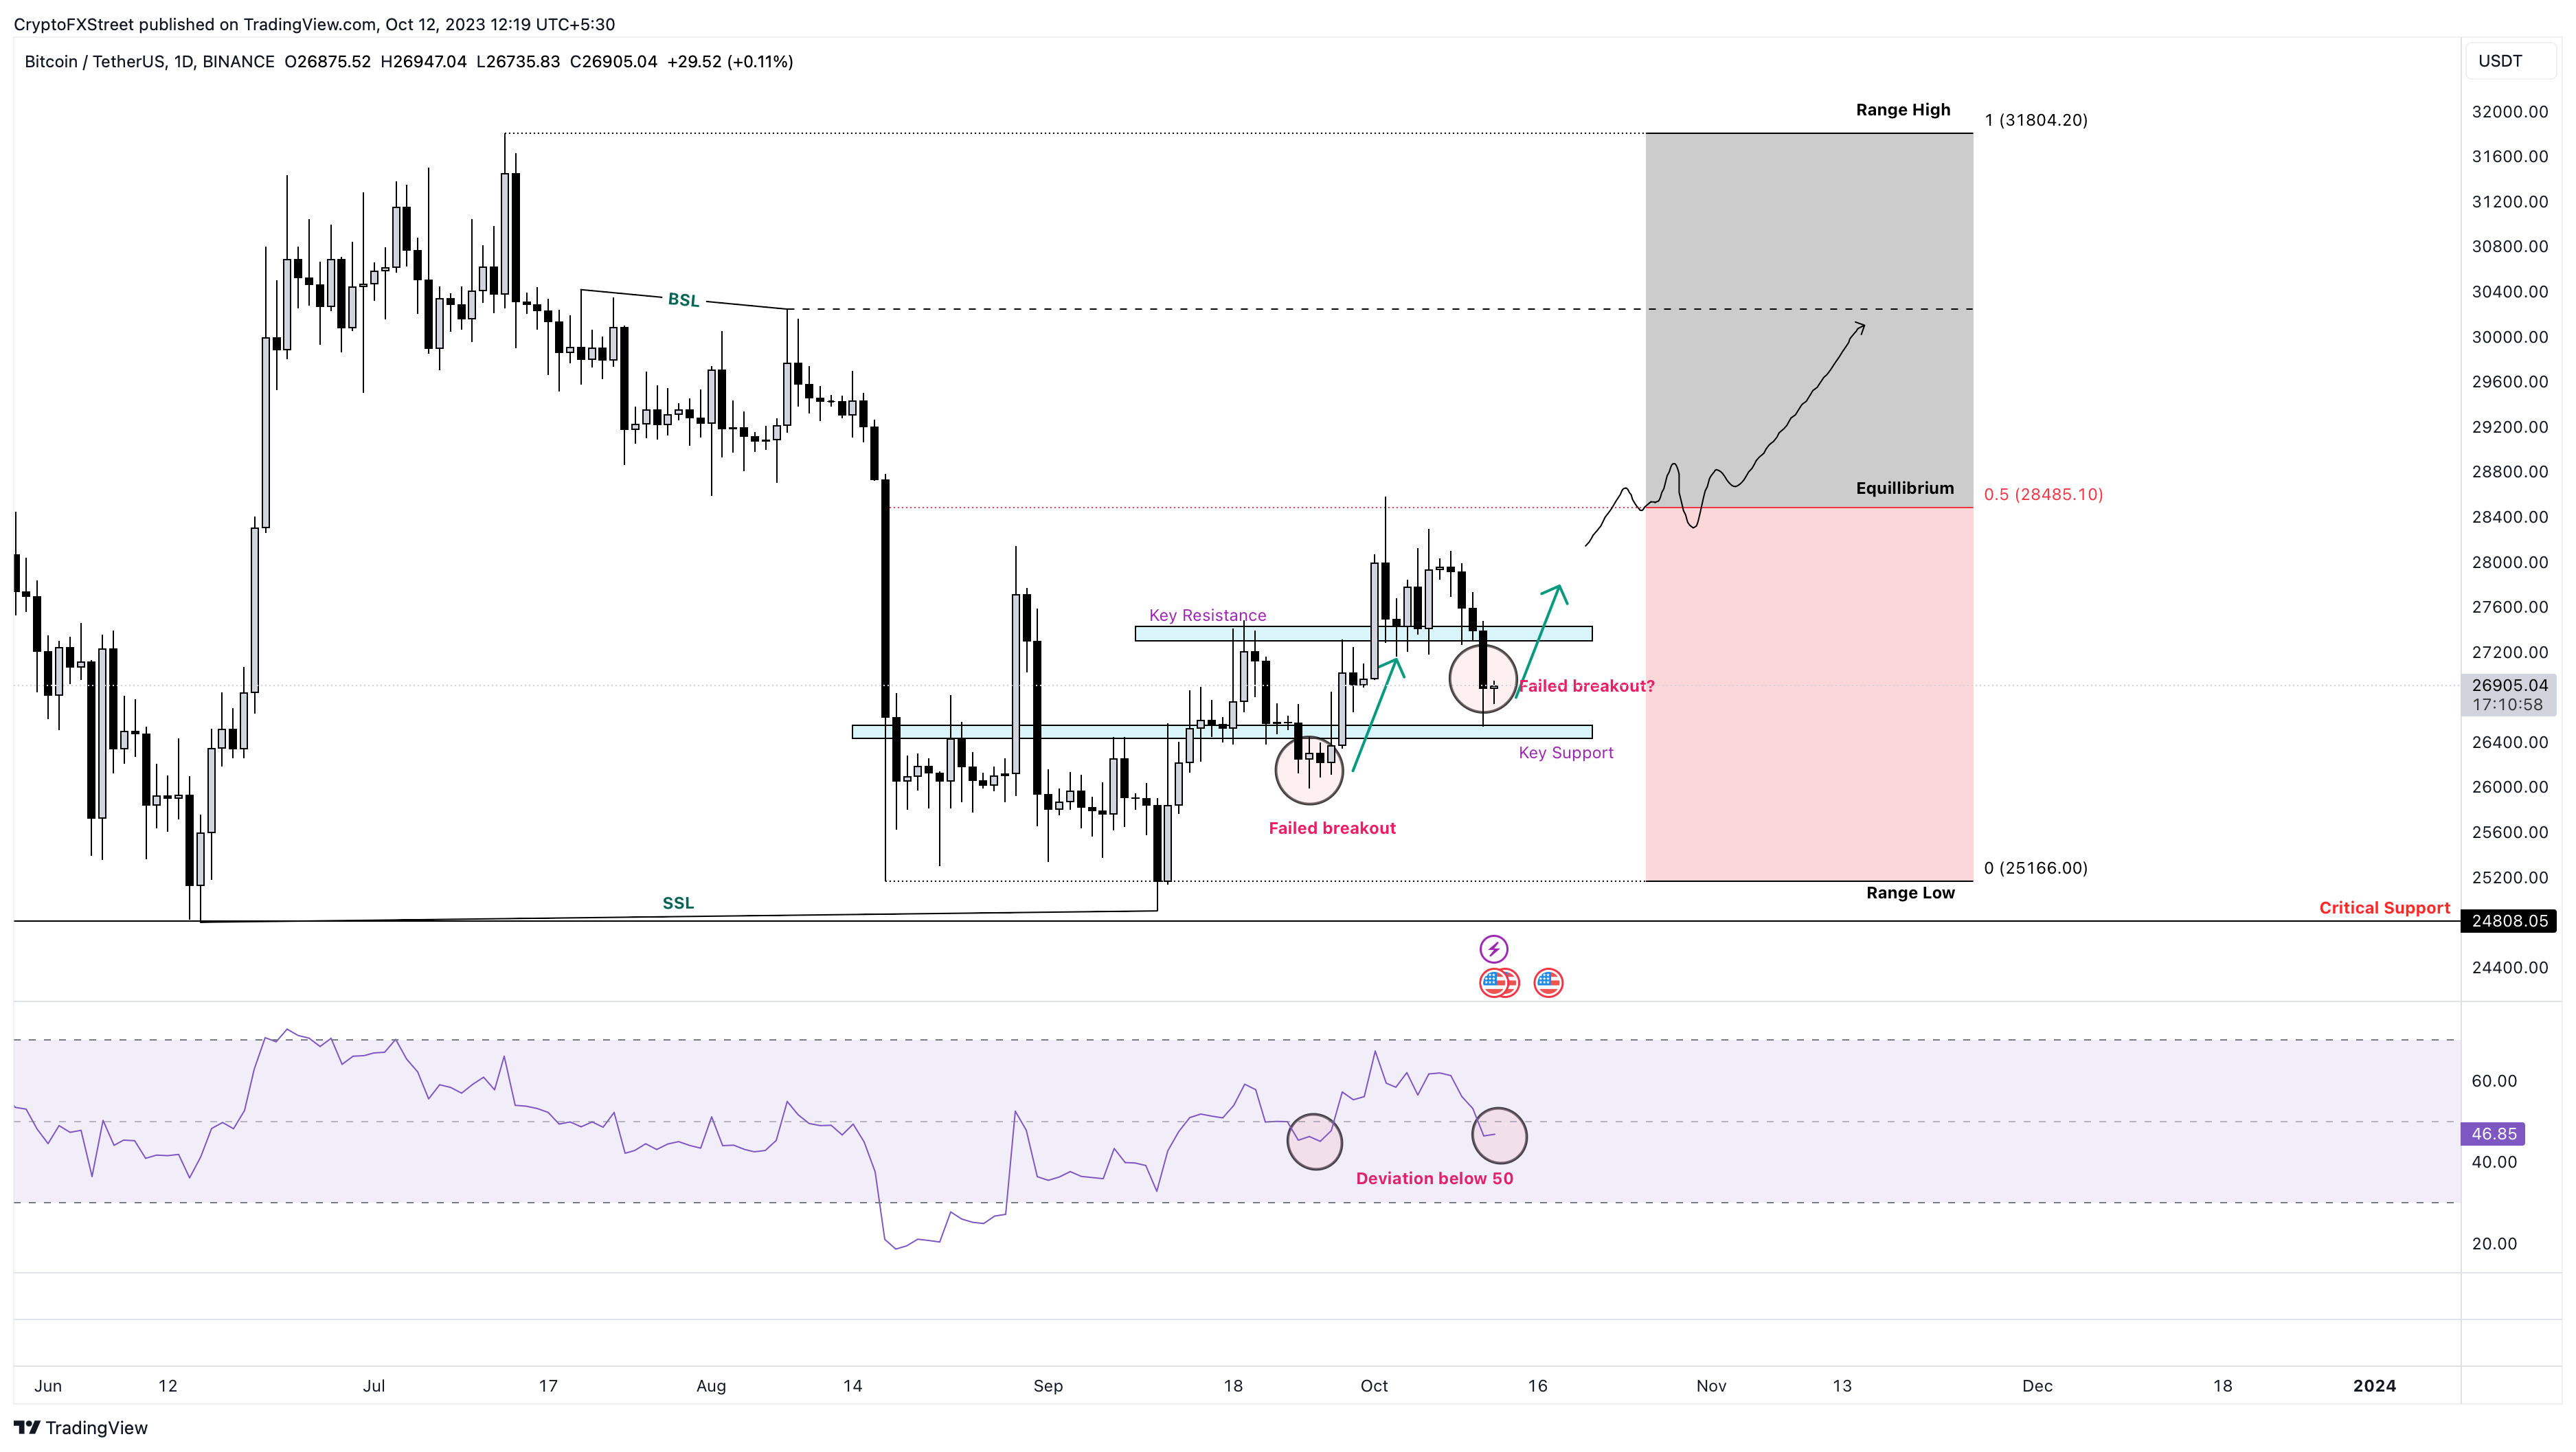
- With key support from $26,400-$26,500 still holding, BTC could recover to breach the key resistance around the $27,300-$27,400 zone.
- A sudden reversal could catch investors off-guard, liquidating many bears, considering the overall bearish market sentiment.

Bitcoin (BTC) price is likely to pull back, if history is enough to go by, leaving bear sellers to suffer after multiple failed breakouts.
Meanwhile, the US Consumer Price Index (CPI) coming in above expectations has inspired a fresh wave of bearish sentiment across the market. The report on the Thursday CPI reading has reignited speculations for another interest-rate hike by the US Federal Reserve (Fed). It came above the 3.6% estimate, recording 3.7% YoY, an unchanged reading from August.
The data has catalyzed the US Dollar rally and sent risk assets, including Bitcoin, further down. With inflation proving sticky, there is a renewed risk-off mood from investors, with Gold, stocks, and Bitcoin likely to tumble.
Cryptocurrency prices FAQs
How do new token launches or listings affect cryptocurrency prices?
Token launches like Arbitrum’s ARB airdrop and Optimism OP influence demand and adoption among market participants. Listings on crypto exchanges deepen the liquidity for an asset and add new participants to an asset’s network. This is typically bullish for a digital asset.
How do hacks affect cryptocurrency prices?
A hack is an event in which an attacker captures a large volume of the asset from a DeFi bridge or hot wallet of an exchange or any other crypto platform via exploits, bugs or other methods. The exploiter then transfers these tokens out of the exchange platforms to ultimately sell or swap the assets for other cryptocurrencies or stablecoins. Such events often involve an en masse panic triggering a sell-off in the affected assets.
How do macroeconomic releases and events affect cryptocurrency prices?
Macroeconomic events like the US Federal Reserve’s decision on interest rates influence risk assets like Bitcoin, mainly through the direct impact they have on the US Dollar. An increase in interest rate typically negatively influences Bitcoin and altcoin prices, and vice versa. If the US Dollar index declines, risk assets and associated leverage for trading gets cheaper, in turn driving crypto prices higher.
How do major crypto upgrades like halvings, hard forks affect cryptocurrency prices?
Halvings are typically considered bullish events as they slash the block reward in half for miners, constricting the supply of the asset. At consistent demand if the supply reduces, the asset’s price climbs. This has been observed in Bitcoin and Litecoin.
Daily Digest Market Movers: Bitcoin extends losses as market sentiment sours
With the week’s 5% dip, bearish sentiment continues to span the expanse of the market, with Santiment's mid-term trends showing Consumer Price Index (CPI), inflation and bear market searches are trending as investors look for possible implications.
-638327433521215739.png)
Santiment mid-term trends
Technical Analysis: Bitcoin price coils up for a squeeze
Bitcoin (BTC) price has dropped almost 5% so far in the week, moving from the Sunday high of $28,095 to the current price of $26,719. It remains below the equilibrium of a market range measured from $25,166 to $31,804.
if history repeats, Bitcoin price could record yet another failed breakout, pulling back in a surprise move that could catch the bears off guard. Short sellers would suffer if such a scenario plays out. With the key support holding, the move could see BTC break past the key resistance ranging from $27,300 to $27,400.
In a highly bullish case, the gains could extend past the equilibrium level of $28,485. A decisive move above this level would increase the odds for an extended move above the $30,000 psychological level.
The RSI is already deviating from its initial southbound move below the 50 level, suggesting bulls are already in play. In a previous article, we reported an anticipated squeeze, presented as a rapid change in the price of an asset thanks to the forced closure of positions. With short sellers closing their positions in panic, their countering buying pressure is likely to provide hindwinds for the surge.
BTC/USDT 1-day chart
On the flip side, the position of the Relative Strength Index (RSI) below 50 suggests a continued slump that could see Bitcoin price break below the key support extending from $26,400 and $26,500. A break and close below this level could send BTC to the depths of the $26,000 psychological level. In the dire case, the losses could extrapolate to the bottom of the market range at around $25,166.
Also Read: What can crypto traders expect from Thursday’s US CPI?
Author

Lockridge Okoth
FXStreet
Lockridge is a believer in the transformative power of crypto and the blockchain industry.


