Bitcoin Weekly Forecast: BTC to revisit $52,000 after recent sell-off [Video]
- Bitcoin price is extremely close to a local bottom that could kick-start a run-up to $52,100.
- Transaction and holder data supports the technical perspective’s bullish outlook.
- A daily close below the $39,000 level will create a lower low, indicating that a further downswing is likely.
![Bitcoin Weekly Forecast: BTC to revisit $52,000 after recent sell-off [Video]](https://editorial.fxstreet.com/images/Markets/Currencies/Digital Currencies/Bitcoin/bitcoins-33646574.jpg)
Bitcoin price shows dual nature as it undergoes another sell-off albeit a relatively smaller one compared to the ones seen on December 4, 2021, and January 4. Ironically, the downswing presents a bullish opportunity as it sets the perfect stage for a move higher. From a long-term perspective, however, there is still room for the big crypto to slide lower.
Bitcoin price and the bull case
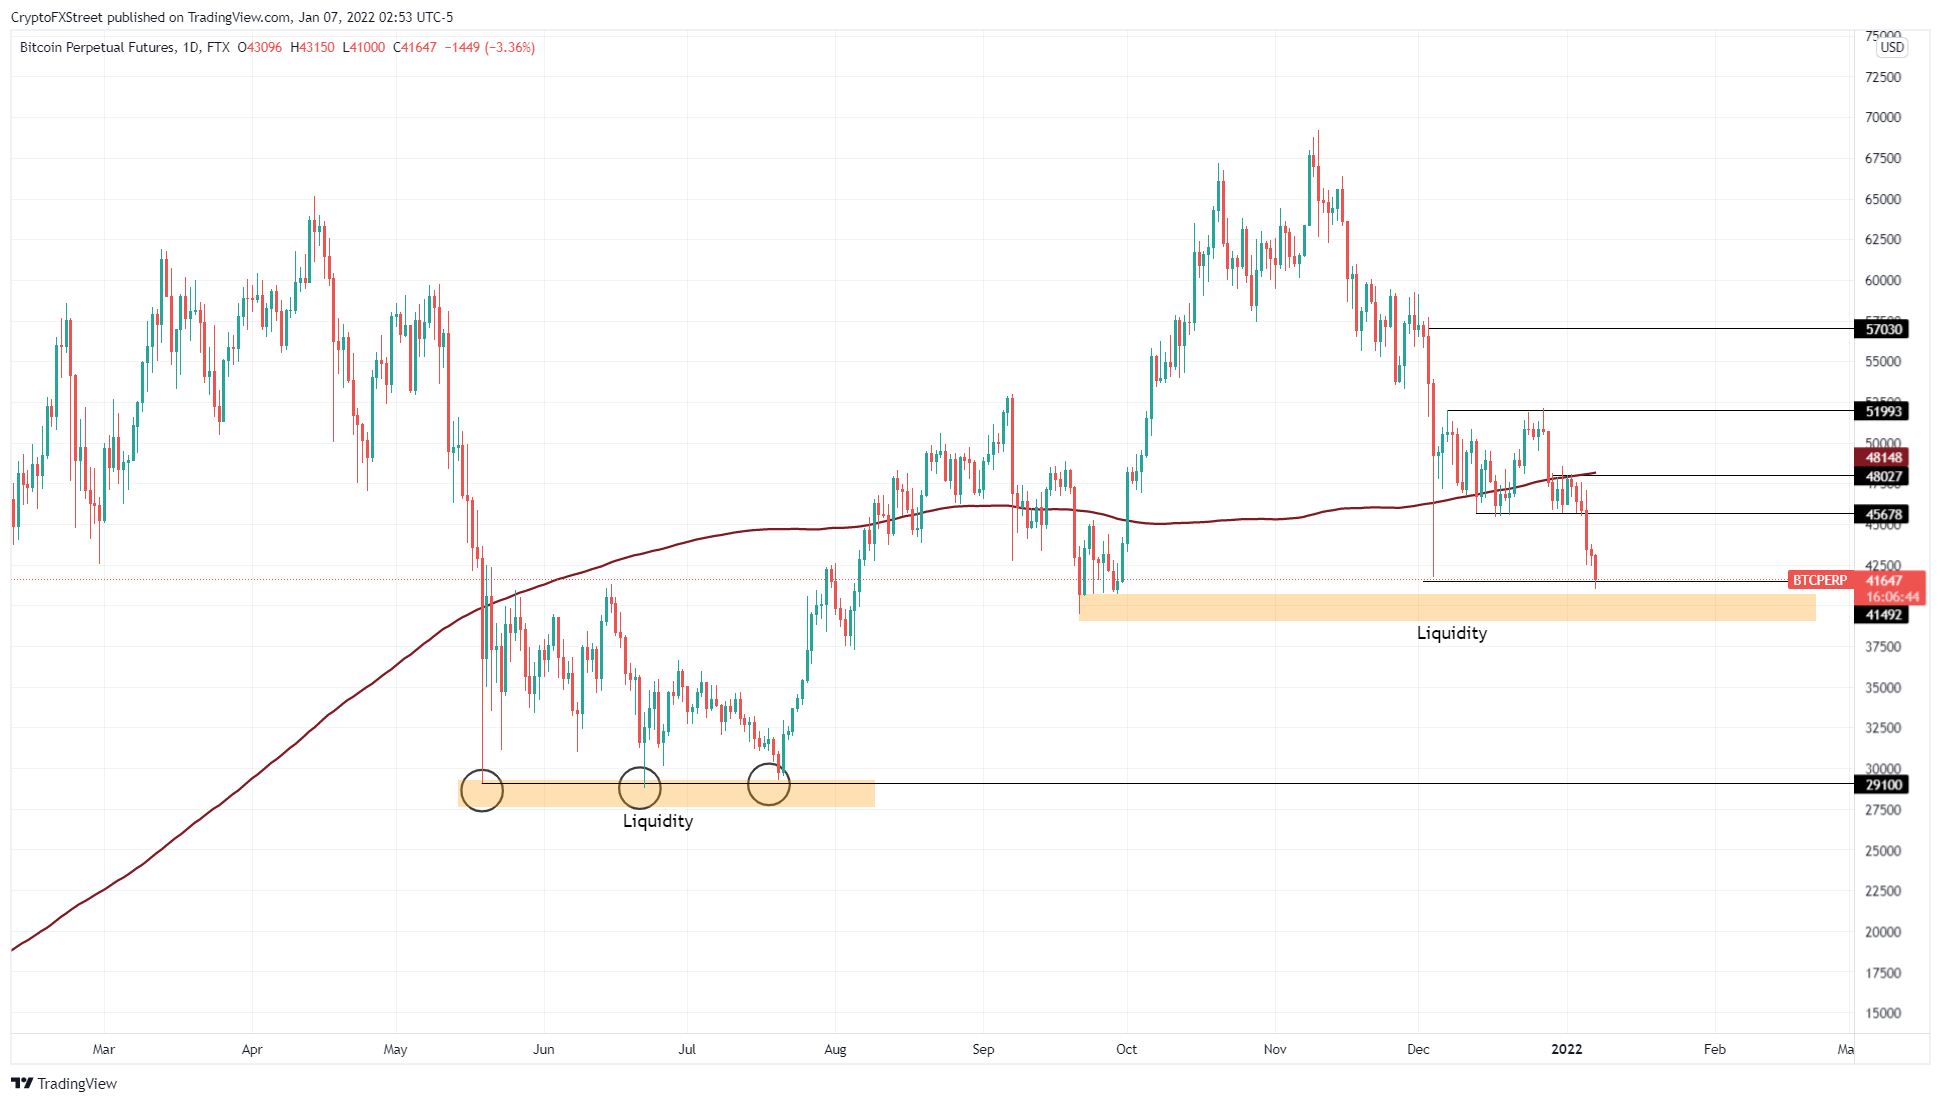
Bitcoin price has dropped 40% from its all-time high at $69,000 and is currently trading below the December 4, 2021, swing low at $41,762. If BTC recovers swiftly above this level, the quick sweep will serve as a liquidity run, confirming that an uptrend is likely.
If that is the case, market participants can expect BTC to undo the losses experienced since January 5. This development will also propel the big crypto to produce a swing high above Monday’s high at $47,609.
In total, this run-up would constitute a 16% advance from the current position - $41,368. Investors can consider the sweep above $47,609 as a pitstop and a place where BTC could consolidate, providing a support level for a second leg-up.
For the second half of the bullish outlook, Bitcoin price will eye a move into the liquidity zone that is present above the double top formation at $52,150, coinciding with the previous week’s high.
From a conservative standpoint, $52,150 is where traders in long positions are likely to book profits. However, with strong winds, Bitcoin price could attempt to fill the fair value gap (FVG), extending from $51,993 to $56,489. The upper limit of this price inefficiency coincides with the daily demand, making it a strong ceiling and a final destination for this uptrend.
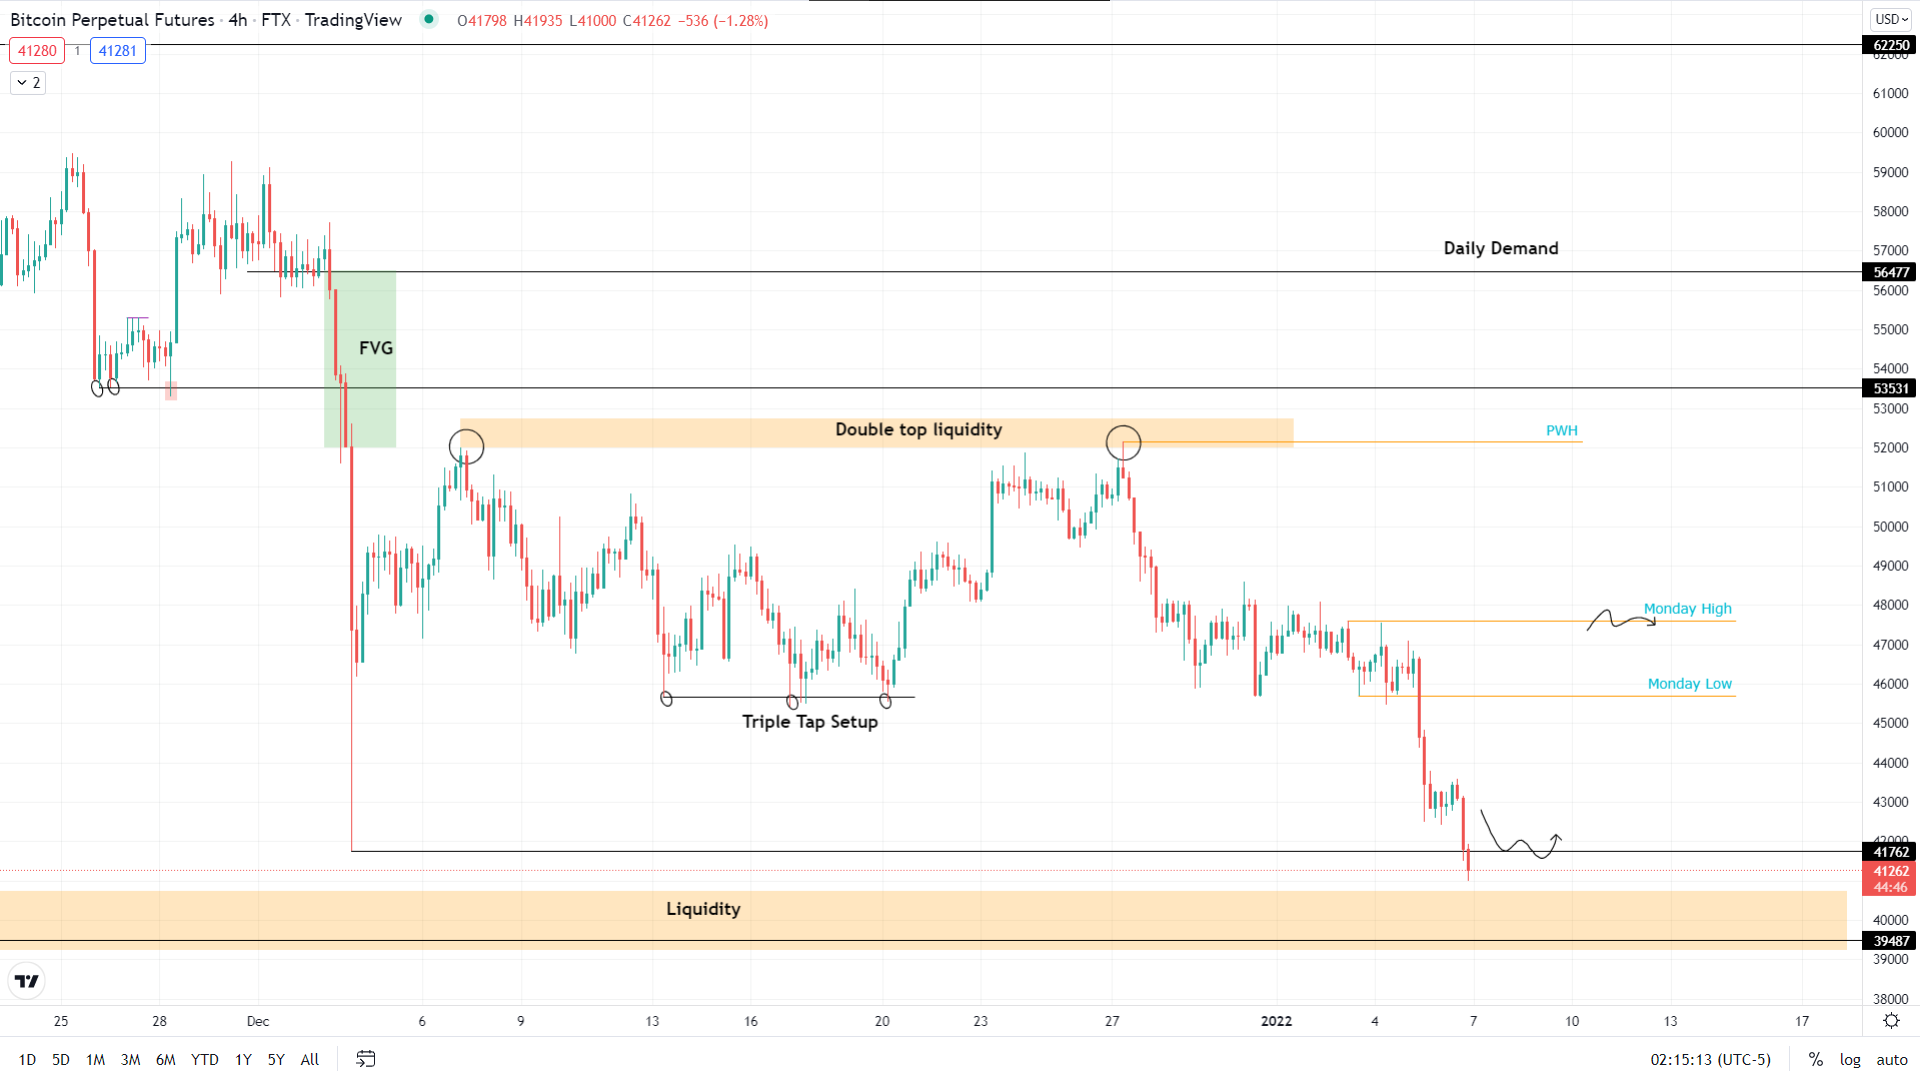
BTC/USDT 4-hour chart
Supporting this massively bullish outlook for Bitcoin price is IntoTheBlock’s Global In/Out of the Money (GIOM) model. This on-chain index shows that BTC has already dipped into the immediate support level that extends from $33,392 to $42,169.
Here, roughly 2.83 million addresses that purchased 1.63 million BTC exist. These investors are likely to add more to their holdings, increasing the buying pressure. Hence, short-term selling pressure is likely to overcome this bullish momentum.
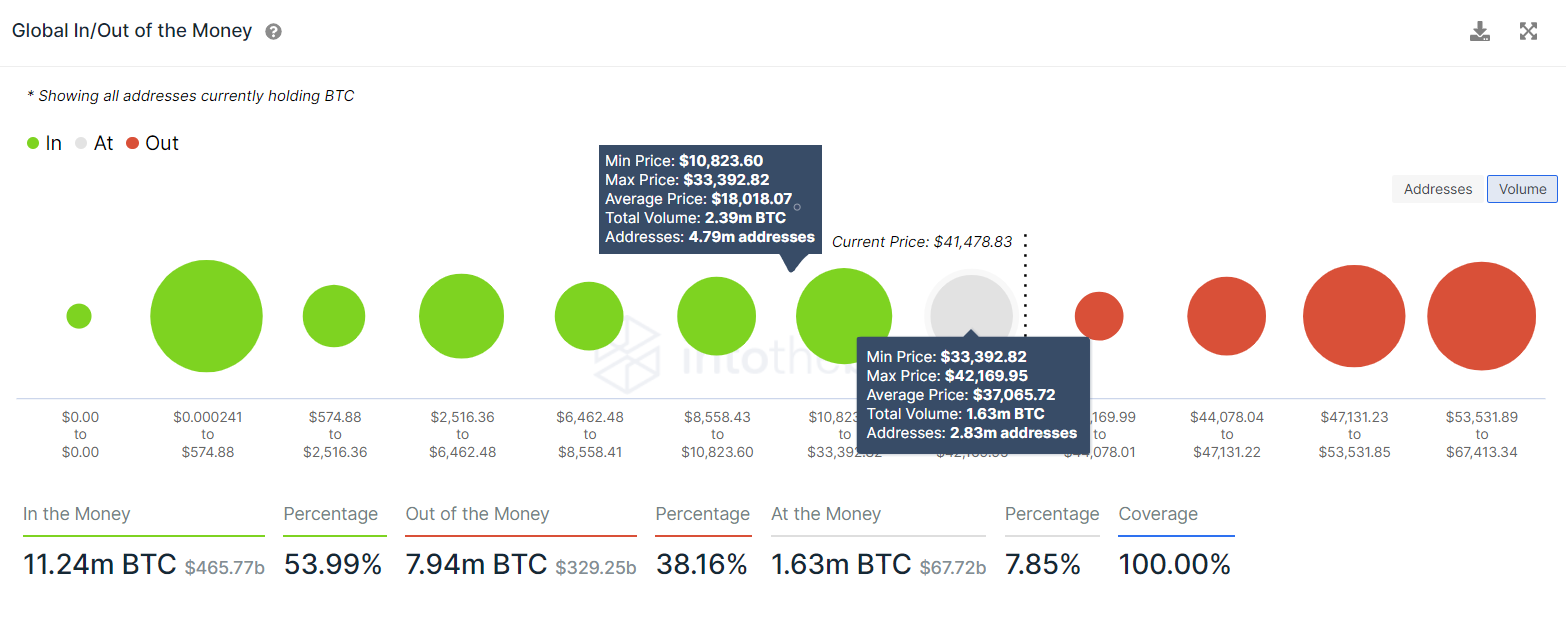
BTC GIOM
The 365-day Market Value to Realized Value (MVRV) model is in the opportunity zone at -14%. This on-chain metric is used to determine the average profit/loss of investors that purchased BTC over the past year.
A negative value indicates that short-term holders are experiencing a loss and are unlikely to sell. However, it is called an “opportunity zone” as long-term holders tend to accumulate in this area.
The lack of selling pressure combined with the increased interest from long-term investors suggests that an uptrend should begin soon.
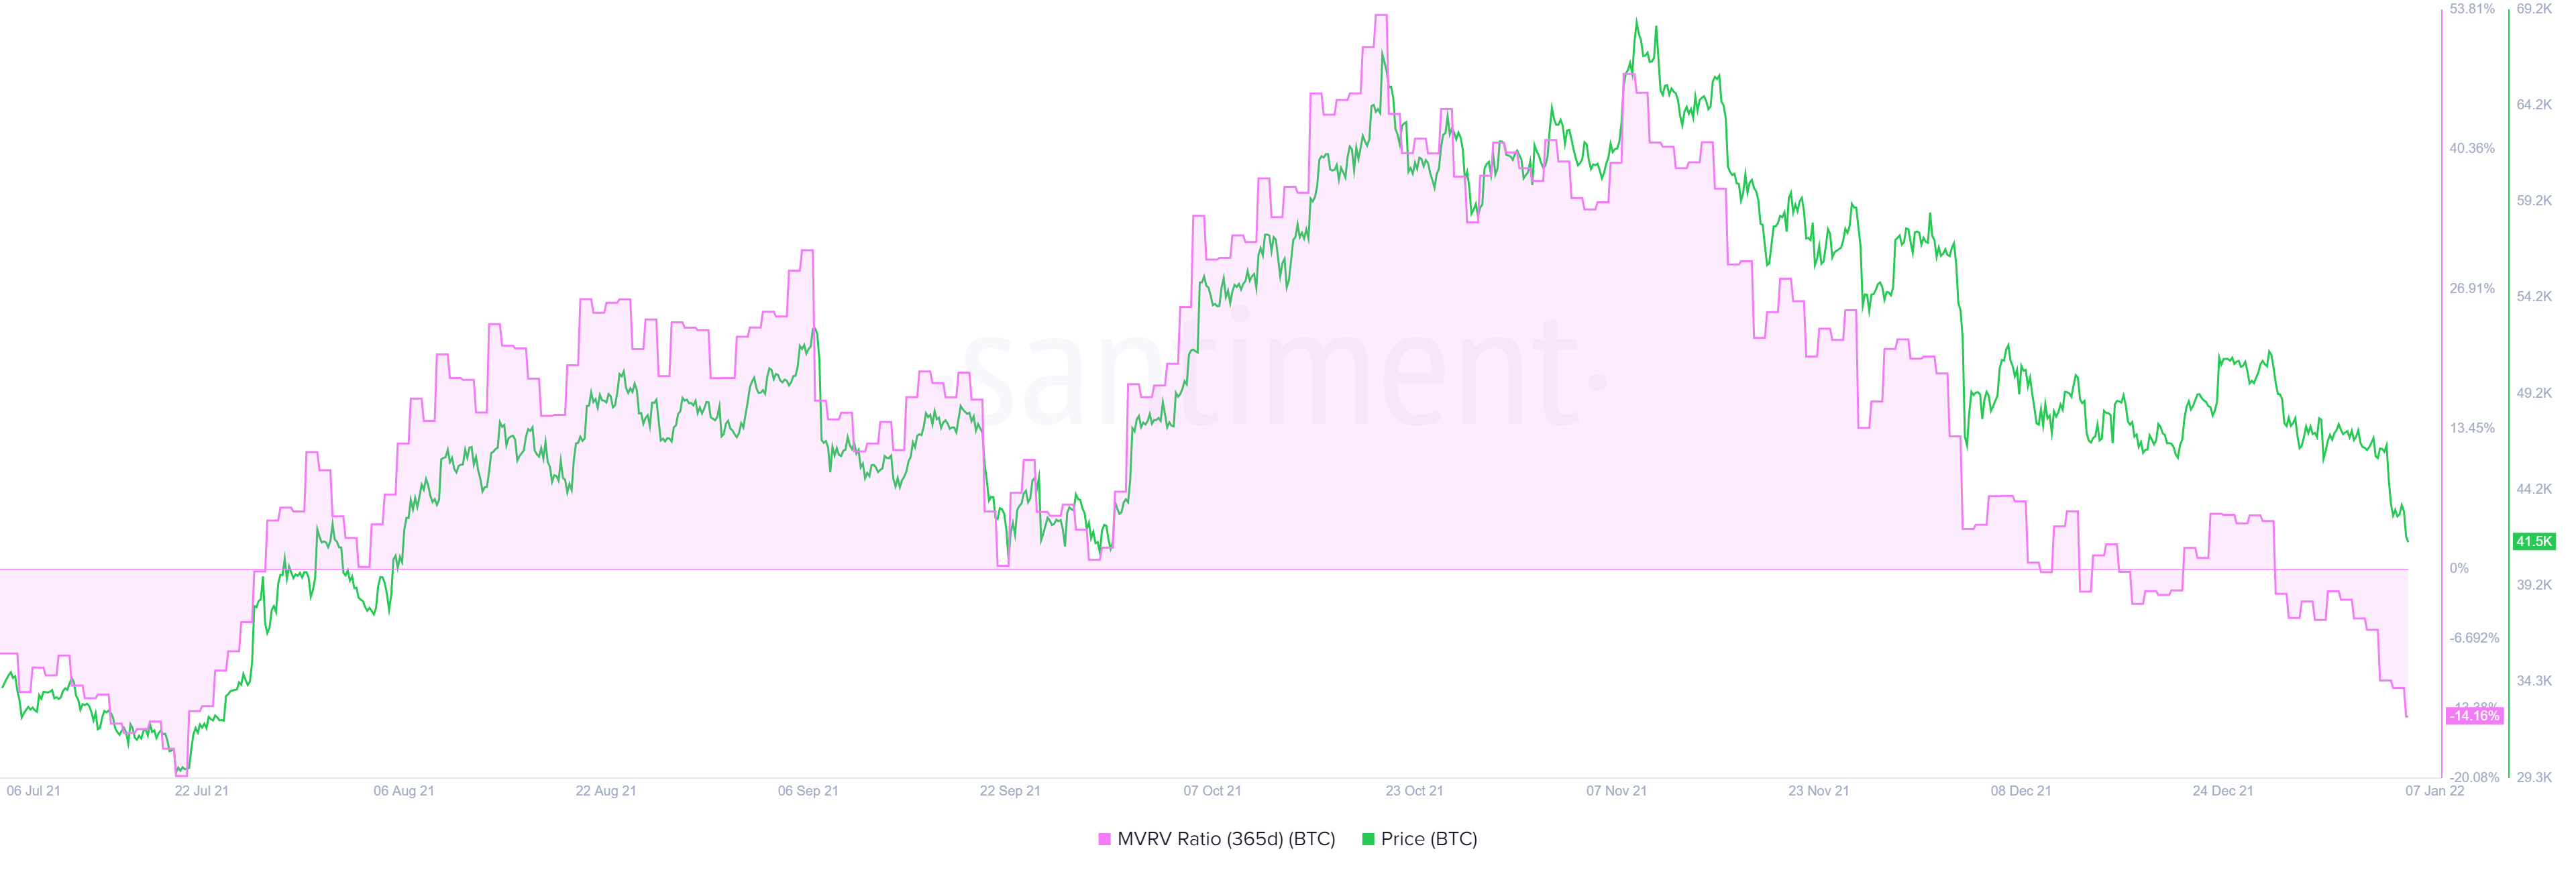
BTC 365-day MVRV
Lastly, the number of new addresses joining the Bitcoin network adds a tailwind to the bullish outlook. This on-chain index has seen roughly 17,830 new addresses joining the BTC network over the past three months indicating that these market participants are interested in BTC at the current price levels.
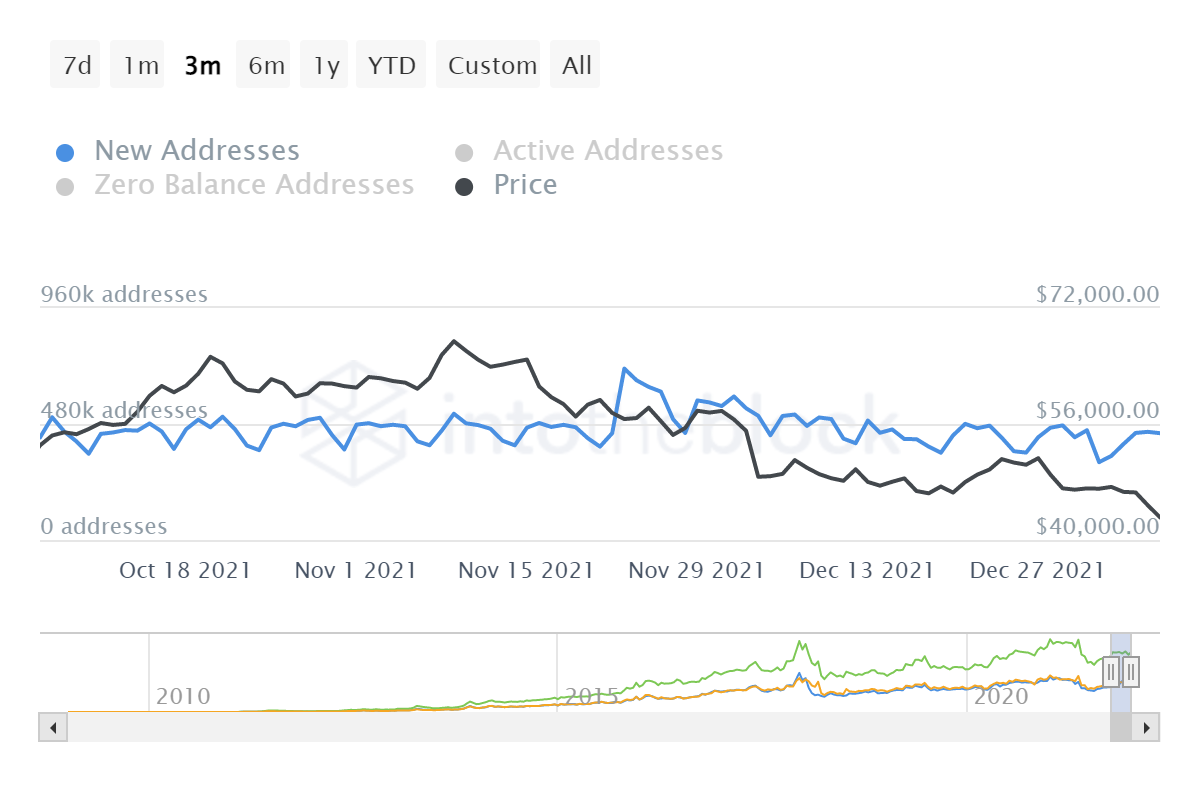
BTC new addresses
The bear case for BTC
Bitcoin price might look bullish after the recent flash crash, but there are two threats that could cut the optimistic outlook short. The 200-day Simple Moving Average (SMA) at $48,148.
A breakdown of the $39,000 level could create a lower low, inducing FOMO among retail traders and triggering a crash to $30,000. The 200-day SMA is a major hurdle for Bitcoin price and it needs to be flipped convincingly to have any chances of heading higher. However, a failure to do this could lead to a retracement to the $41,500 level.
If the selling pressure increases and BTC produces a daily candlestick close below $39,000 it could signal sidelined holders to offload their investments. If this frenzy snowballs, BTC could revisit the $30,000 psychological level.
BTC/USDT 1-day chart
The downside risk can be seen in the GIOM chart posted above. If the immediate support level, ranging from $33,392 to $42,169 gives in, the next barrier extends from $10,823 to $33,392, where roughly 4.79 million addresses purchased 2.39 million BTC.
A dip below $30,000 is not outside the realm of possibility due to the existence of the sell-side liquidity below it.
Supporting this sudden collapse of Bitcoin price is the estimated leverage ratio, which is hovering at an all-time high of 0.224, indicating that the market is tightly wound. Therefore, a flash crash could be the key to triggering a massive sell-off.
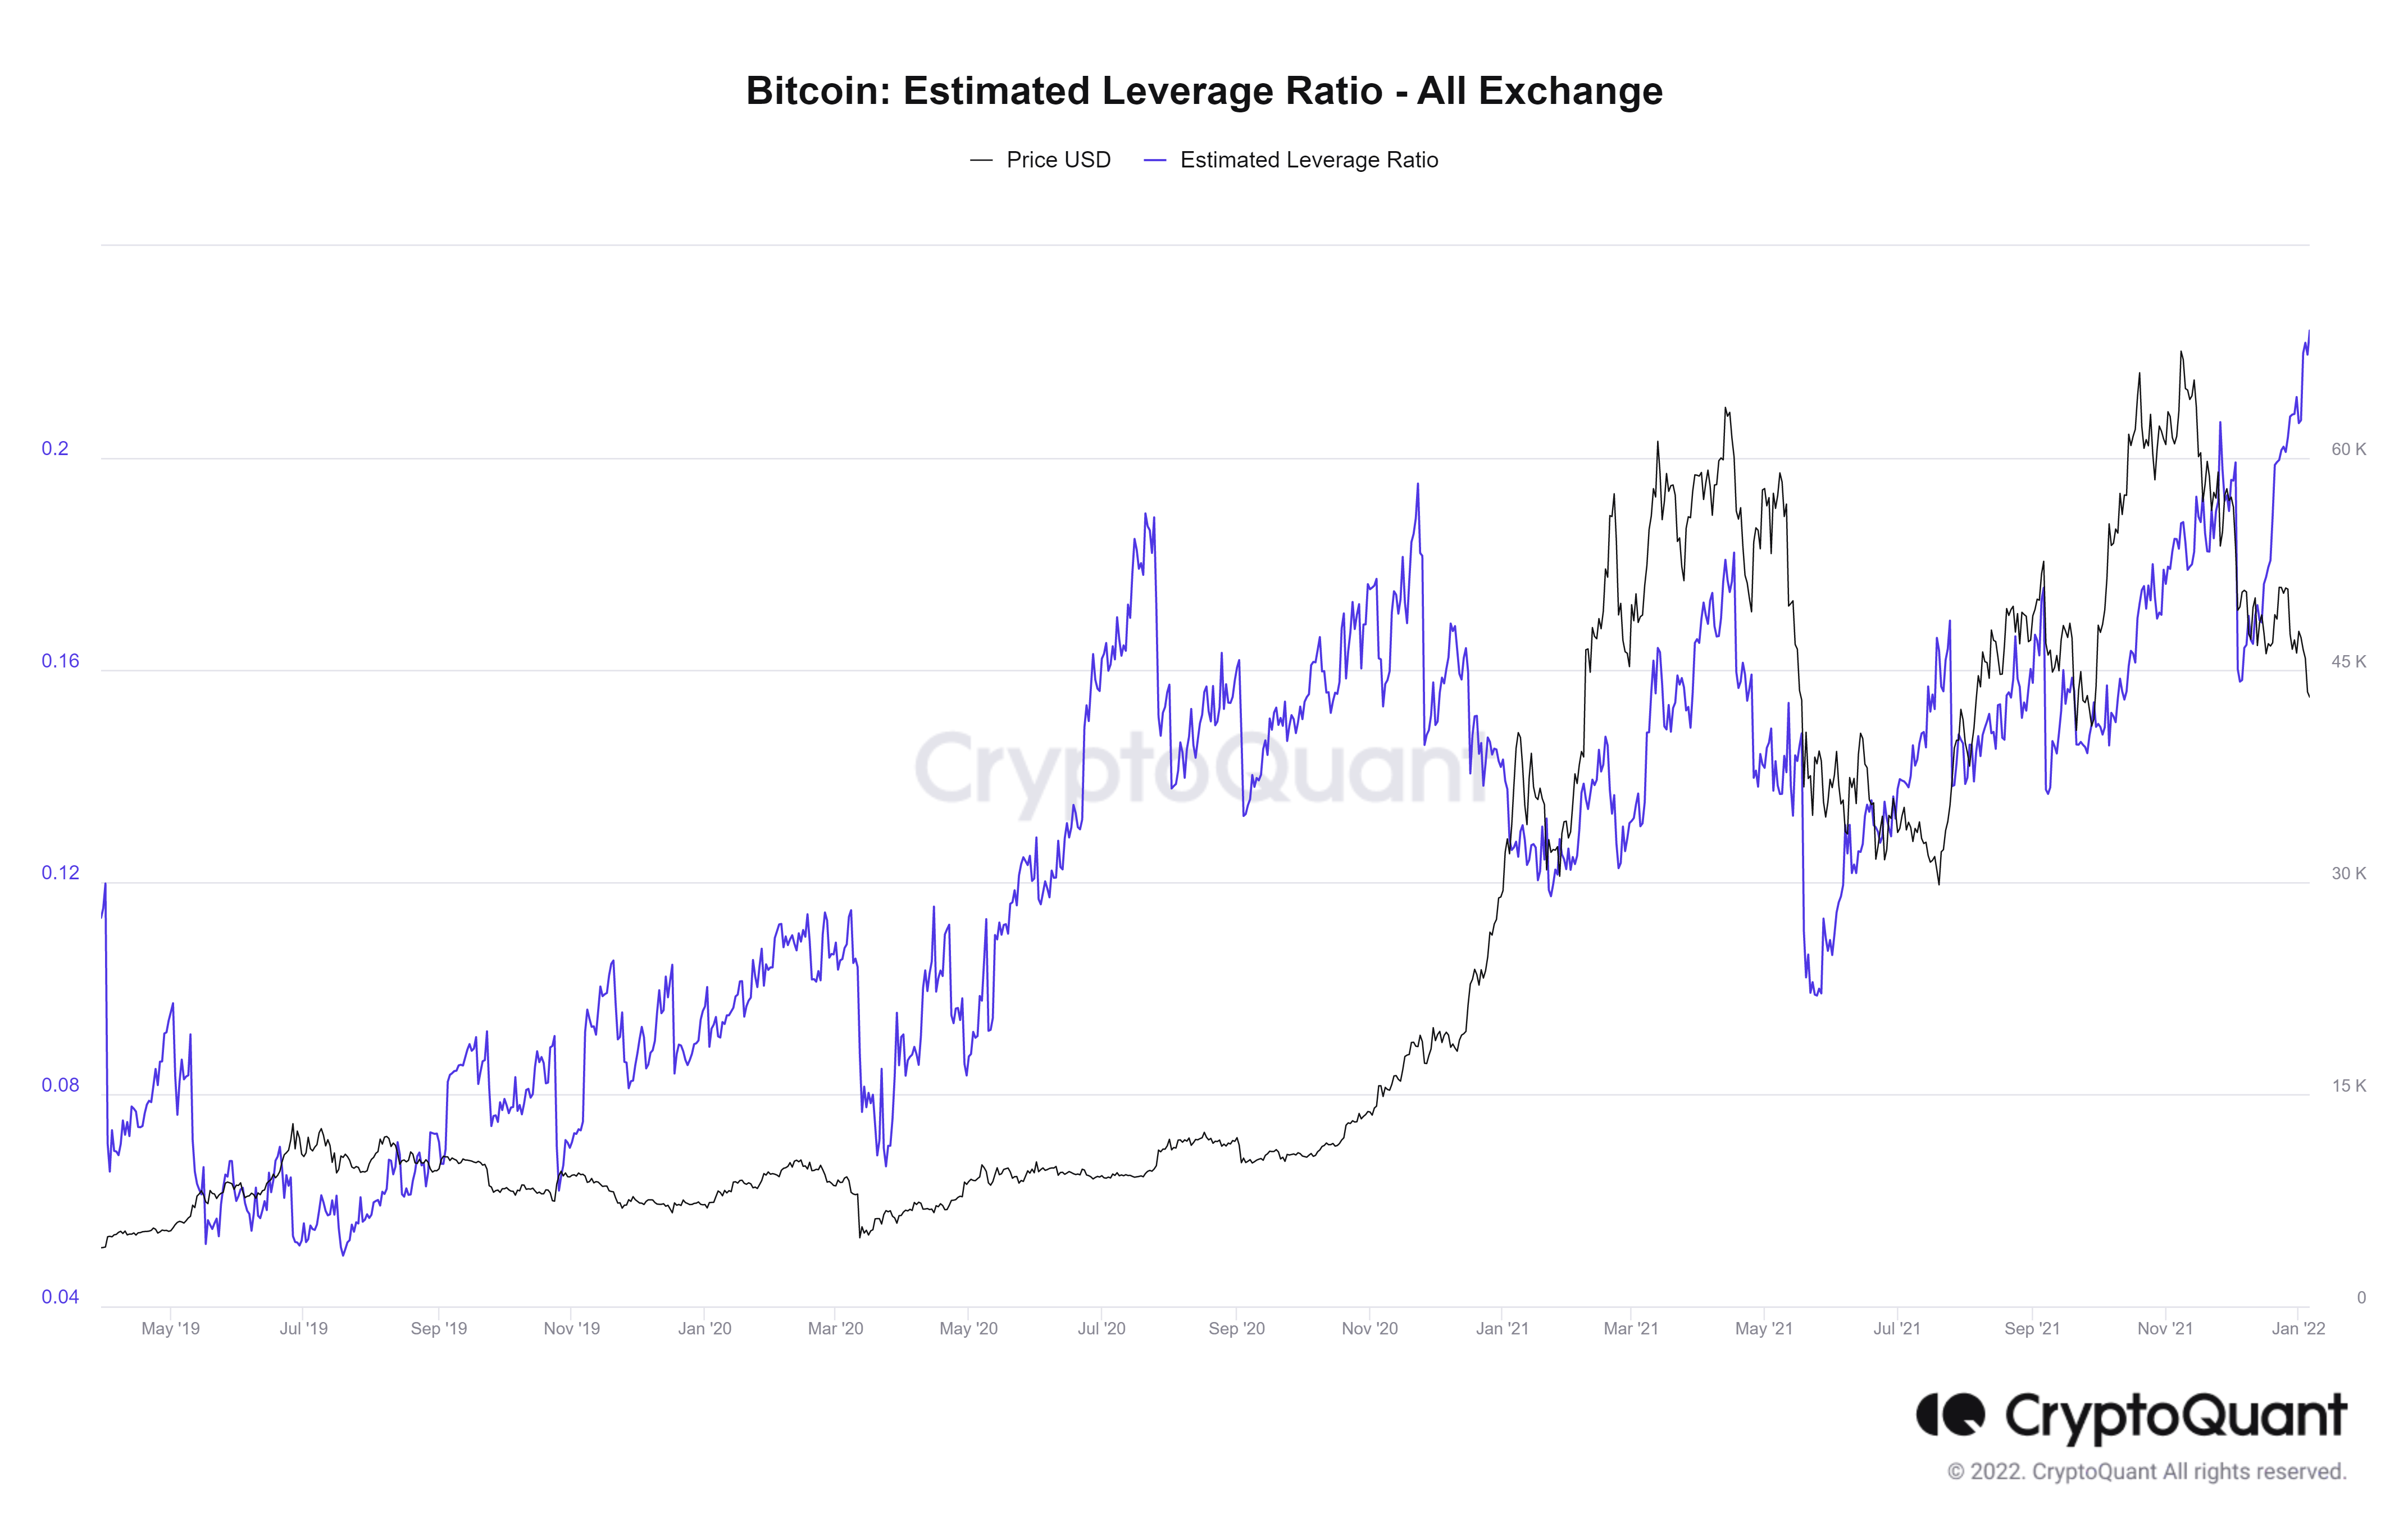
BTC estimated leverage
The supply of BTC on exchanges has increased 2.2 million on December 21, 2021, to 2.25 million on January 7. This increase in 30,000 BTC on centralized entities suggests the possibility of investors moving their funds to book profit.
This adds the potential sell-side pressure, supporting the bearish outlook detailed above.
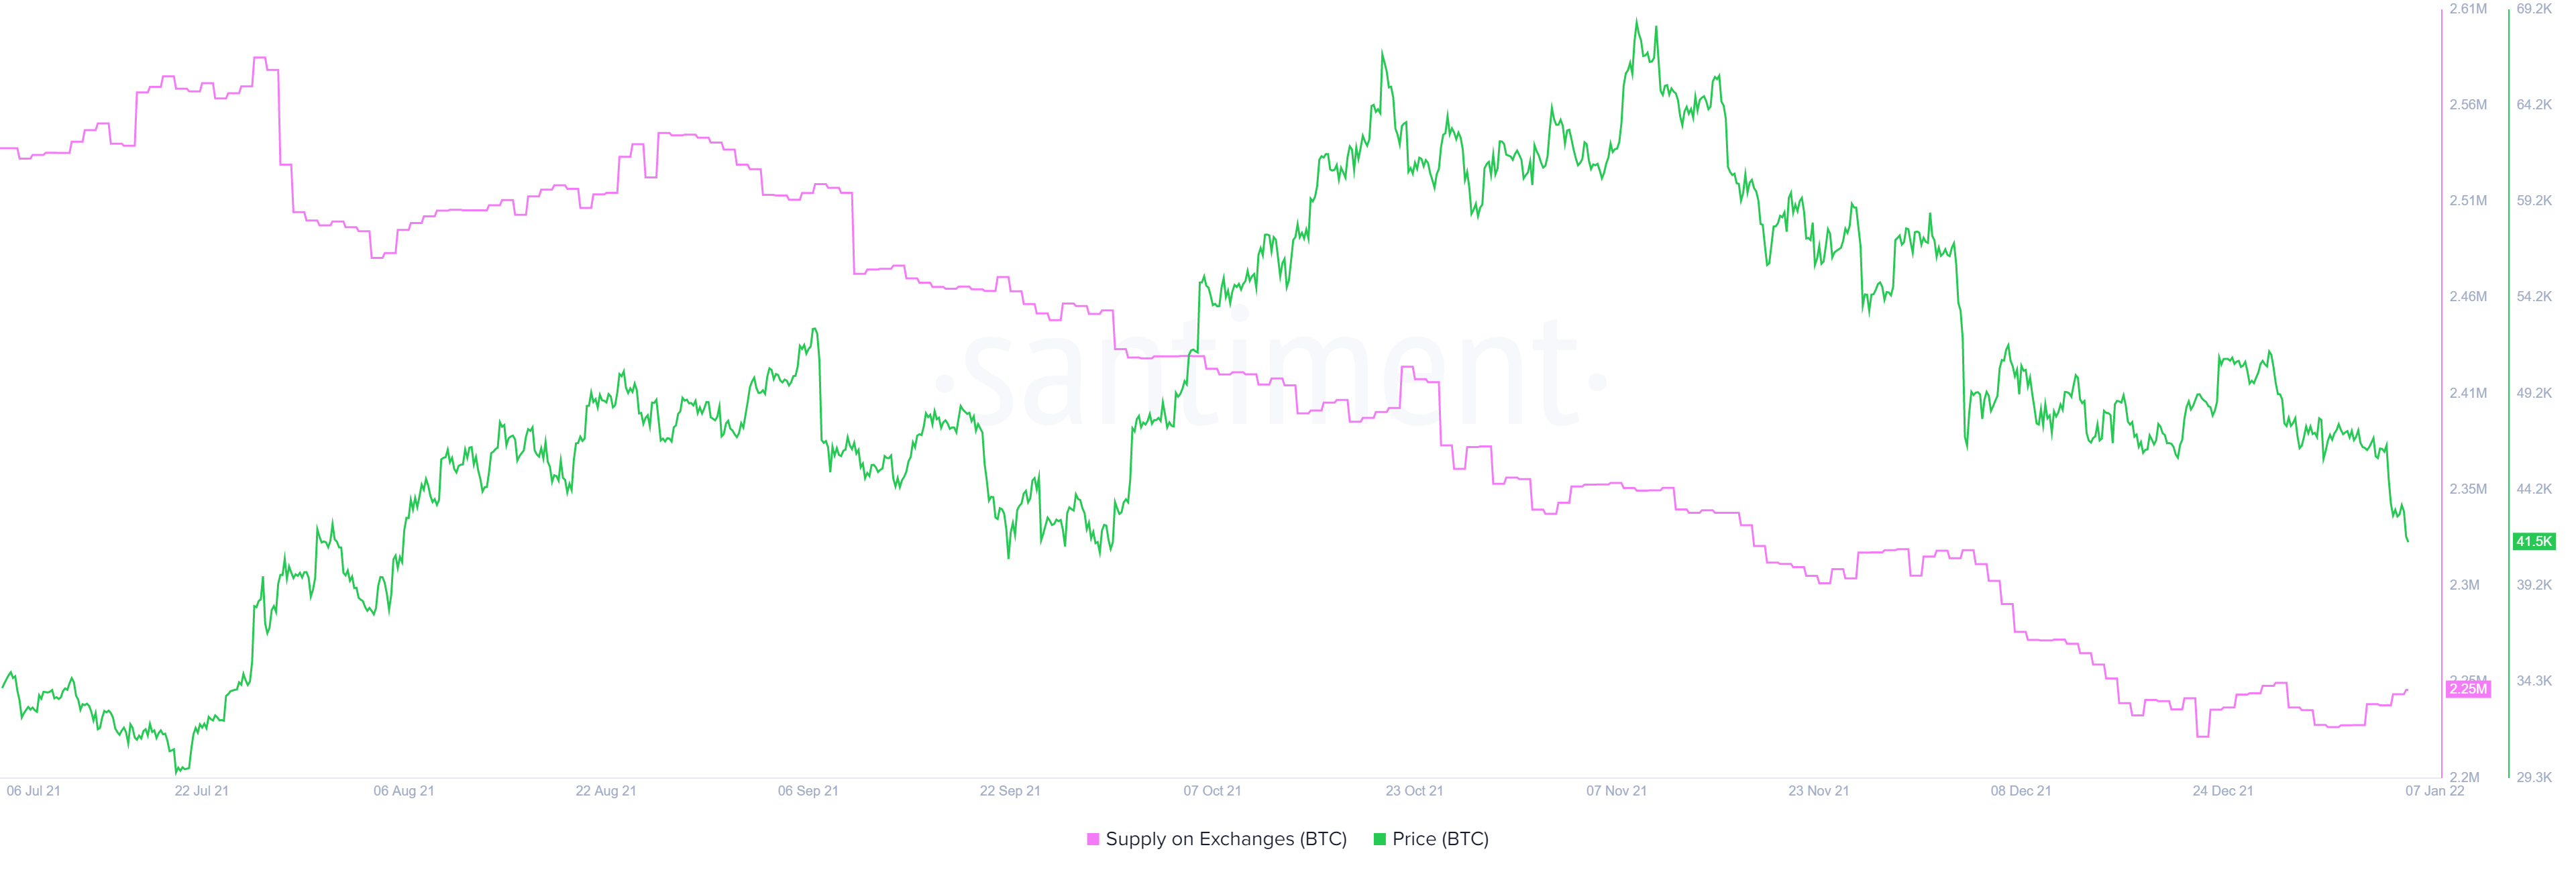
BTC supply on exchanges
Final thoughts
Bitcoin price looks ready for an uptrend from a short-term perspective provided it manages to overcome a major blockade - the 200-day SMA. However, a dire situation will unfold unto BTC and its holders if the $39,000 support floor gives in. In this situation, BTC could crash to $30,000 and venture briefly below it to collect the sell-stop liquidity.
Author

Akash Girimath
FXStreet
Akash Girimath is a Mechanical Engineer interested in the chaos of the financial markets. Trying to make sense of this convoluted yet fascinating space, he switched his engineering job to become a crypto reporter and analyst.


