Bitcoin Weekly Forecast: BTC price at key support screams ‘buy the dip’
- Bitcoin price looks to be facing a momentary downturn on a short-term time frame while the higher time frame looks indecisive as it consolidates.
- On-chain metrics show an ambiguous outlook, suggesting the start of accumulation and the potential for an extended drop.
- Regardless of the technical perspective, BTC adoption seems to be holding up well.

Bitcoin price kick-started a minor uptrend on November 24 but is experiencing a slowdown before reaching its intended target. From a higher time frame perspective, things look to be stationary as BTC continues to consolidate.
BTC remains a strong speculative asset
The flings of US investment bank, Morgan Stanley, revealed that it has increased its exposure to BTC by purchasing more shares of Grayscale Bitcoin Trust (GBTC). Based on the filings with the United States Securities and Exchange Commission (SEC) Morgan Stanely added 592,498 GBTC shares, representing a 63.8% increase in its holdings to 1.52 million shares as of September 30.
As Bitcoin grows more in popularity, more companies will want to get exposure to it, especially considering the rampant printing of US dollars.
On a similar note, Kazakhstan is considering moving to nuclear energy sources to mine BTC due to the power crunch. The country’s Ministry of Energy revealed that it saw an 8% increase in domestic electricity consumption in 2021 due to Bitcoin miners. This sudden spike in electricity consumption comes after China banned digital currency mining in 2021. This development led to a widespread migration of BTC miners to regulation-friendly countries like Kazakhstan.
This uptick in energy consumption also hints that Bitcoin mining is profitable and is being sought out by large institutions, which in turn paints the picture of adoption and demand for the big crypto.
Meanwhile, Indian exchanges saw BTC price tank 9% to 15% as Lok Sabha posted a draft bill that calls for the ban of certain private cryptocurrency transactions.
While this caused FUD among the local users, some pointed that this was the same bill drafted in January. Regardless, the bill will be discussed in the winter session that extends from November to December.
While the sudden downswing was noted only in Indian exchanges, it presented a good opportunity for arbitraging, with traders buying BTC on Indian exchanges and selling abroad. As Bitcoin price hovers just below $60,000 technicals and on-chain metrics present an ambiguous and indecisive outlook for the big crypto while fundamentals are signaling steady growth.
Bitcoin price shows no directional bias
Since last Friday, Bitcoin price has managed to sweep the $59,422 resistance level twice but has failed to retest the $60,000 psychological level. This development suggests that scenario 1 is still in play and BTC is finding it hard to surpass the $58,200 to $61,545 demand zone.
Assuming the buyers manage to produce a daily close above $61,545, it will indicate an affinity for higher prices. In such a case, BTC could aim at the next level, stretching from $63,500 to $65,571. A daily close above that zone will invalidate any bearish outlook and trigger the start of a new bull rally that could propel BTC to the 161.8% Fibonacci extension level at $77,908, a new all-time high.
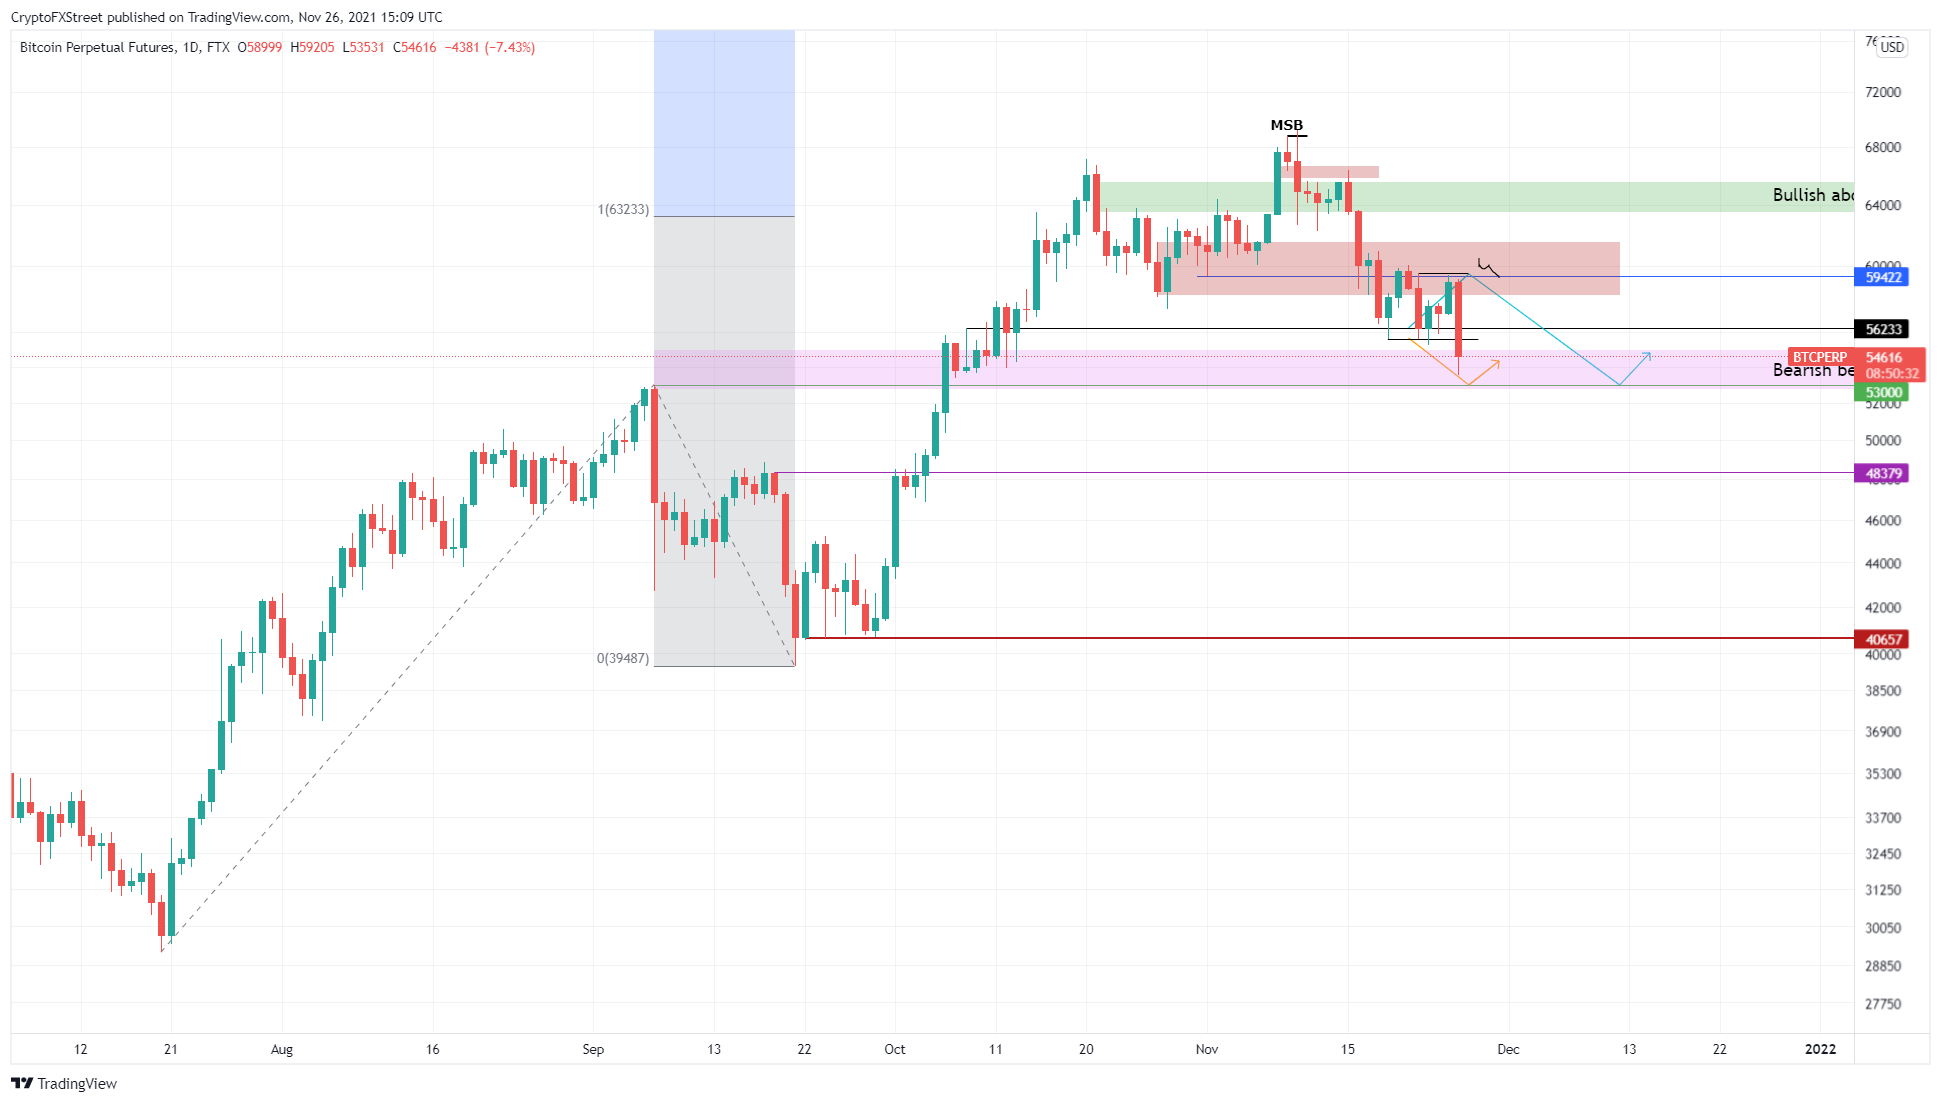
BTC/USDT 1-day chart
While the above scenario may seem like ‘all rainbows and unicorns’, certain on-chain metrics suggest it is possible. For example, the Bitcoin exchange reserve metrics across spots and futures are declining. This trend was observed in July 2021, which marked the end of the bear market. It also notes that there is a sell-side liquidity crunch, hinting at a bullish outlook.
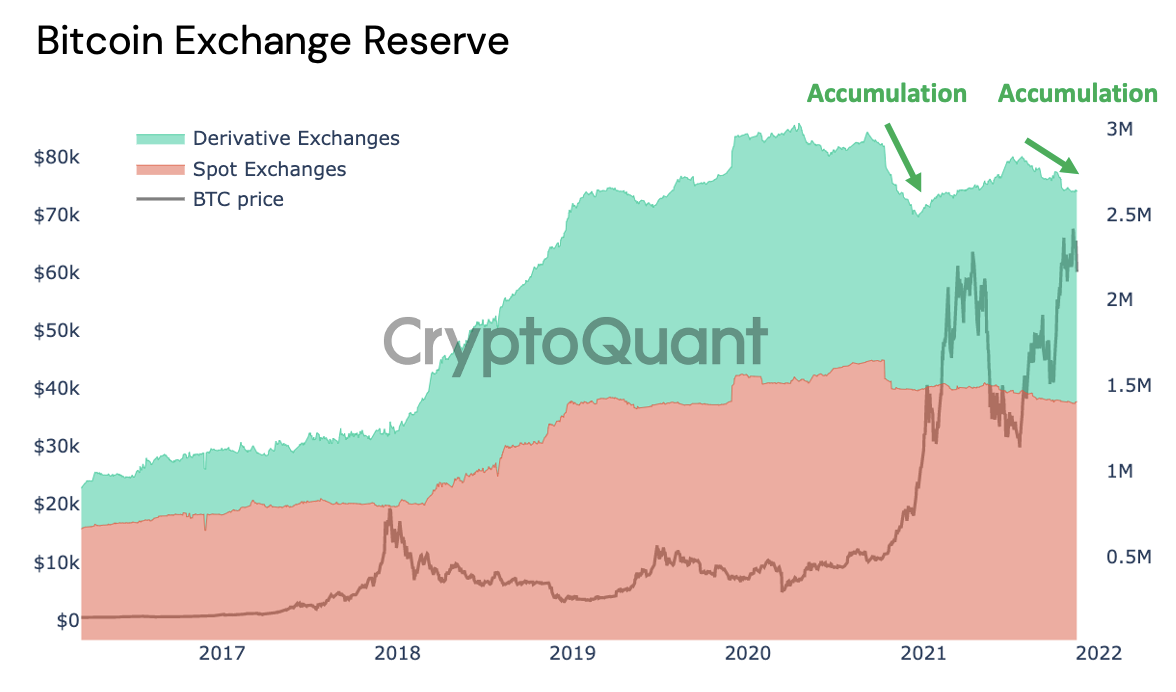
BTC all exchanges reserve chart
On a similar note, the all exchanges netflow chart shows that Bitcoin has seen three consecutive days of large outflows, which also indicates that investors are bullish.
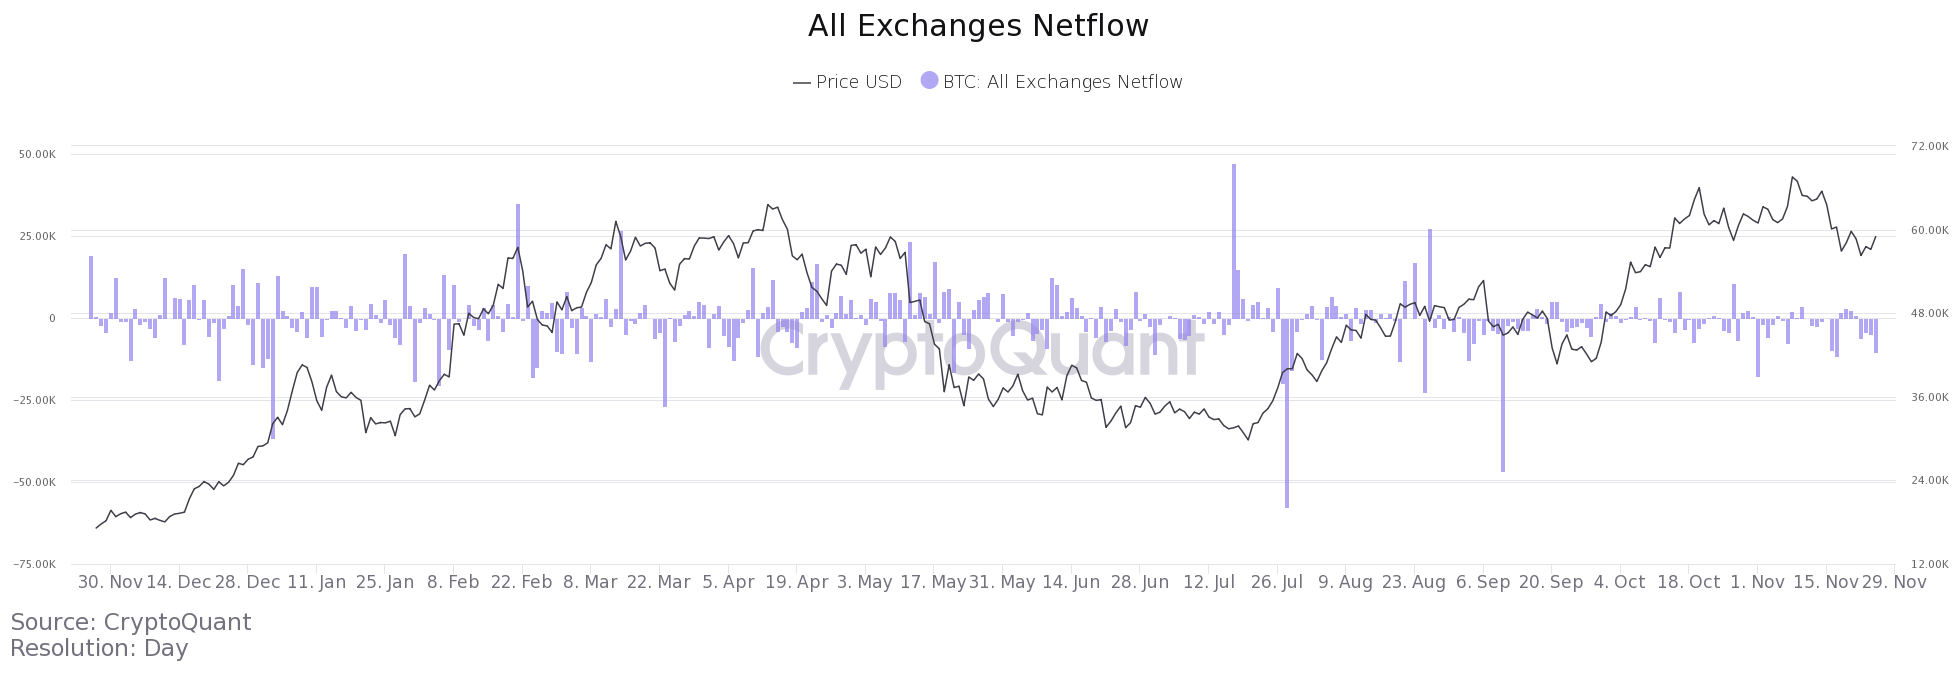
BTC all exchanges netflow chart
A 4-hour chart reveals that an uptrend is possible for BTC, but that the mid-to-long-term future of BTC remains indecisive. Monday’s low at $55,608 has been swept twice over this week, and led to a 7.5% run-up to $59,467. The liquidity resting above Monday’s highs at $60,069, however, remains untouched. Investors can expect this short-term downswing to reverse and make a run for this buy-stop liquidity.
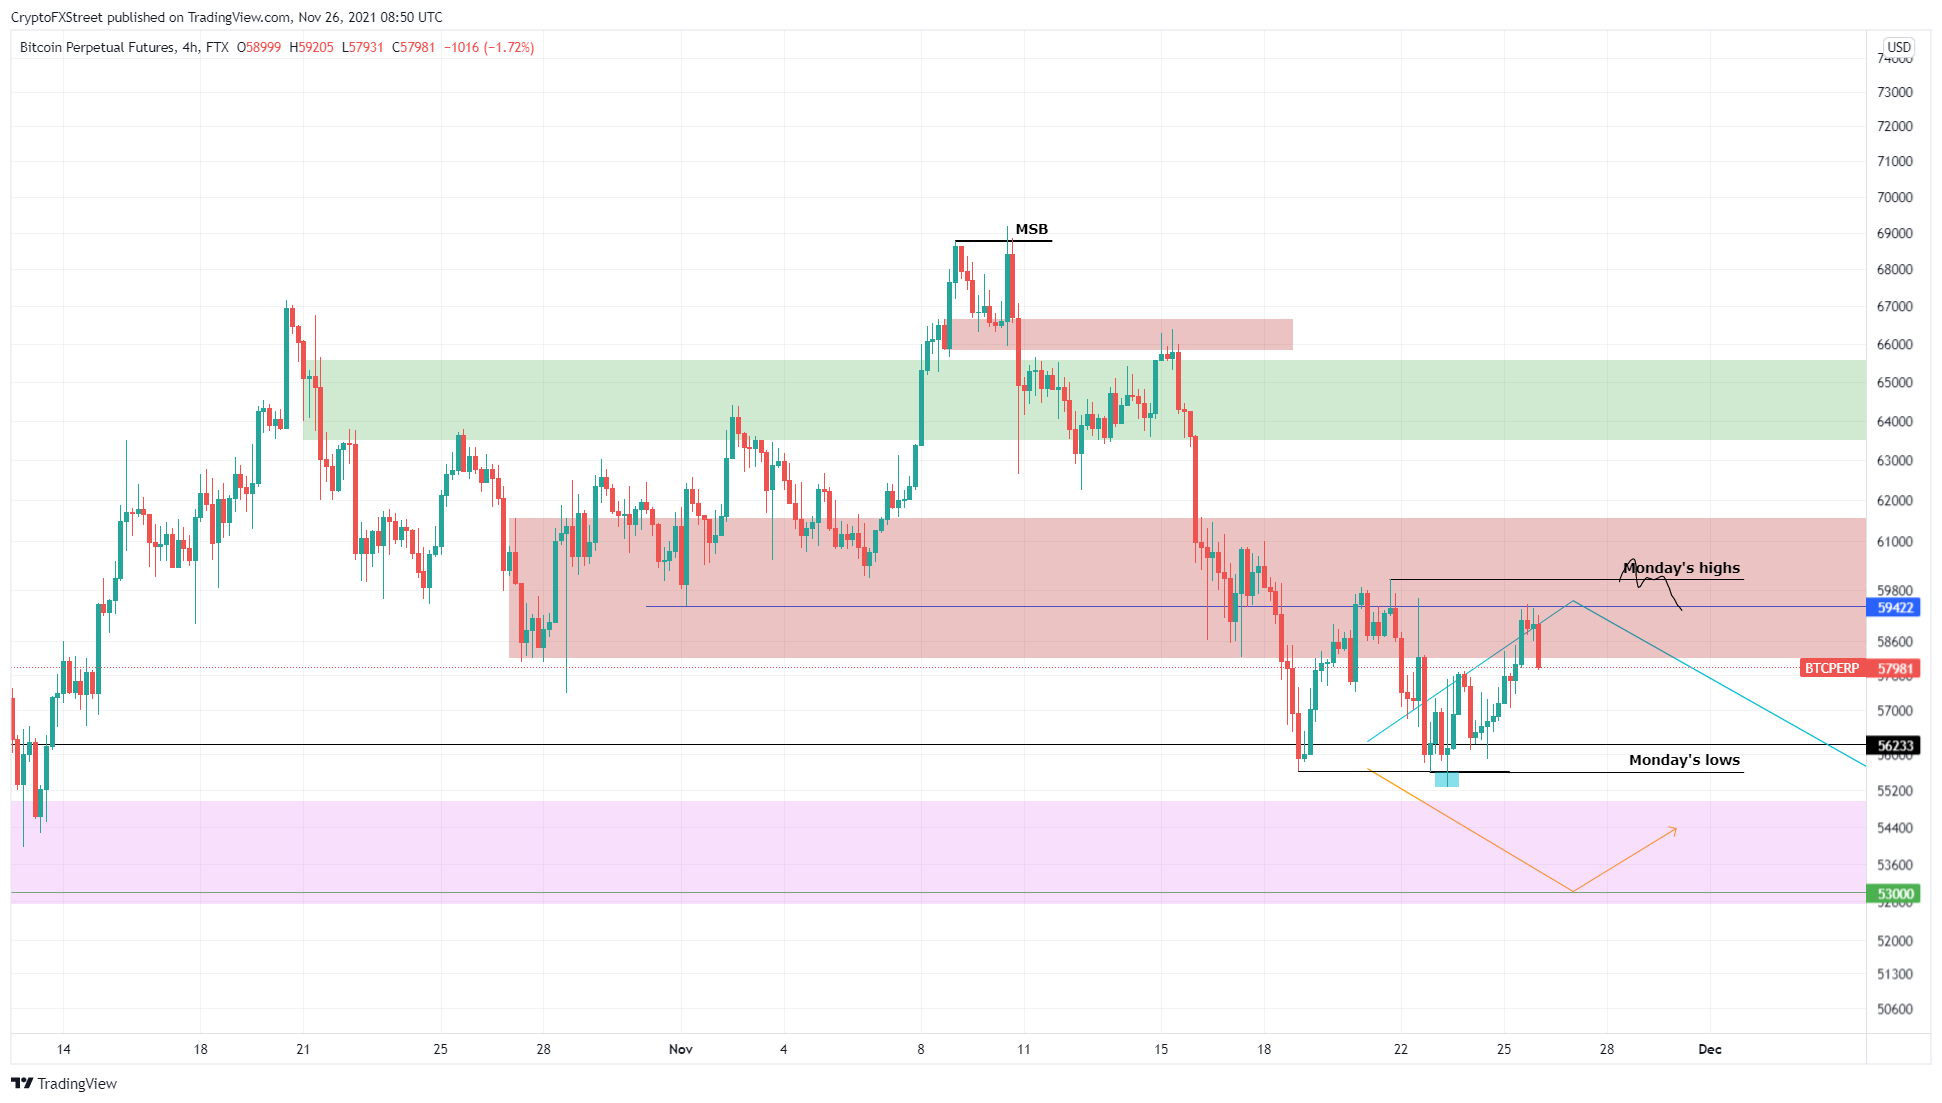
BTC/USDT 4-hour chart
The above scenario is cautiously optimistic and expects BTC to reverse its bullishness and head to $53,000. The 365-day Market Value to Realized Value (MVRV) model supports this downsizing as it hovers around 23%.
This on-chain metric is used to determine the average profit/loss of investors that purchased BTC over the past year. The current level suggests that a lrge portion of investors are still in profit. If these investors decide to sell, it could push BTC price lower and allow the MVRV indicator to head to zero or lower.
Therefore, market participants need to be aware of a potential sell-off.
A daily close below $53,000 will invalidate the bullish thesis and trigger a potential crash to $50,000 or lower.
Author

Akash Girimath
FXStreet
Akash Girimath is a Mechanical Engineer interested in the chaos of the financial markets. Trying to make sense of this convoluted yet fascinating space, he switched his engineering job to become a crypto reporter and analyst.


