Bitcoin Weekly Forecast: BTC hit the pause button before a decisive breakthrough
- BTC/USD calmed down after wild price swings during the weekend.
- The upside momentum will be resumed after a short pause.
- The fundamental factors remain supportive of the first digital asset.
Bitcoin lived through a wild roller-coaster move during the previous weekend. The coin hit the new 2020 high above $12,000 and crashed to $10,500 in a matter of hours. However, the first digital asset managed to stay within the dominant bullish trend and resume the upside move after a short-period of range-bound trading in the beginning of the week. At the time of writing, BTC/USD is changing hands at $11,800 with $12,000 looming large. If the current momentum is sustained, the coin may retest the recent maximum before the next Monday.
Bitcoin's on-chain stats continued to improve as the price increased. Over 93% or 29 million Bitcoin addresses are in the money at the current price, and only 4% of users bought their coins at a higher price. Strong resistance is created in the area of $11,750-$12,000 as that's where a cluster of 560,000 BTC addresses have their breakeven point. Once it is cleared, $12,500 will come into focus.
Notably, the number of large transactions increased by nearly 50% from 10,000 on August 2 to over 14,000 by press time. The market volatility is also on the rise. Currently, the 30-day volatility is registered at 34.5% from 31% one week earlier. The combination of those factors signal that the trading activity is gaining traction.
Bitcoin's fundamental factors
The first digital currency is mostly isolated from the global market developments. However, the skyrocketing gold prices and the ongoing spat between China and the US serve as a supportive factor for the bullish trend in the cryptocurrency market. Bitcoin often referred to as digital gold, attracts investors' attention due to its anti-inflationary features and a decentralized nature, which makes it immune to the interventions of the global monetary authorities. Basically, may traditional players consider adding BTC to their investment portfolios to hedge inflation risks.
The global central banks, including FED pledge to keep rates as the historically low levels and propose new fiscal stimulus to support the suffering economy. The consequences of an unorthodox monetary policy and unstoppable money-printing are largely unknown, and digital assets may eventually serve as a backstop that will safe the financial system from collapse. Many experts note that unlimited liquidity inflows keep zombi-companies afloat and feed the ungrounded optimism on the stock markets. Once the party is over, the hang-over may be really severe.
BTC/USD: Technical picture
On a daily chart, BTC/USD has come close to the upper boundary of the recent consolidation channel. The coin topped at $12,000 during the previous week and may continue moving forward, once this barrier is out of the way. While BTC/USD is still well below the all-time high, a sustainable move above this area will take us to uncharted territory. The upside momentum may start snowballing and bring $13,000 into focus before the end of the next week.
On the downside, the local support is created by psychological $11,000; however, in the long run, the trend is bullish as long as the price stays above $10,500. This barrier served as a strong resistance during the previous consolidation pattern and stopped the sell-off during the collapse from above $12,000 on August 2. A move below this line will darken the technical picture and attract new bears to the market. In this case, the sell-off may be extended towards $10,000 and $9,800 reinforced by daily SMA50 and SMA100.
The daily RSI stays flat close to overbought territory, which means the coin may spend some time at the current levels before the growth is resumed.
BTC/USD daily chart
-637324047536363248.png)
On a weekly chart, Bitcoin (BTC) has printed the doji candle after the biggest green candle since the end of May, which is a positive signal in the long run. The price broke free from the long-term channel limited by $10,000, which now serves as pivotal technical support. Once it is out of the way, the sell-off is likely to gain traction with the next focus on the lower boundary of the above-mentioned broken channel at $8,750 reinforced by the downward-looking weekly SMA50 at $8,660. This technical level has been limiting Bitcoin's decline since the beginning of May and now it is the backstop that separates the downside correction from the outright bearish trend.
BTC/USD weekly chart
-637324049360474060.png)
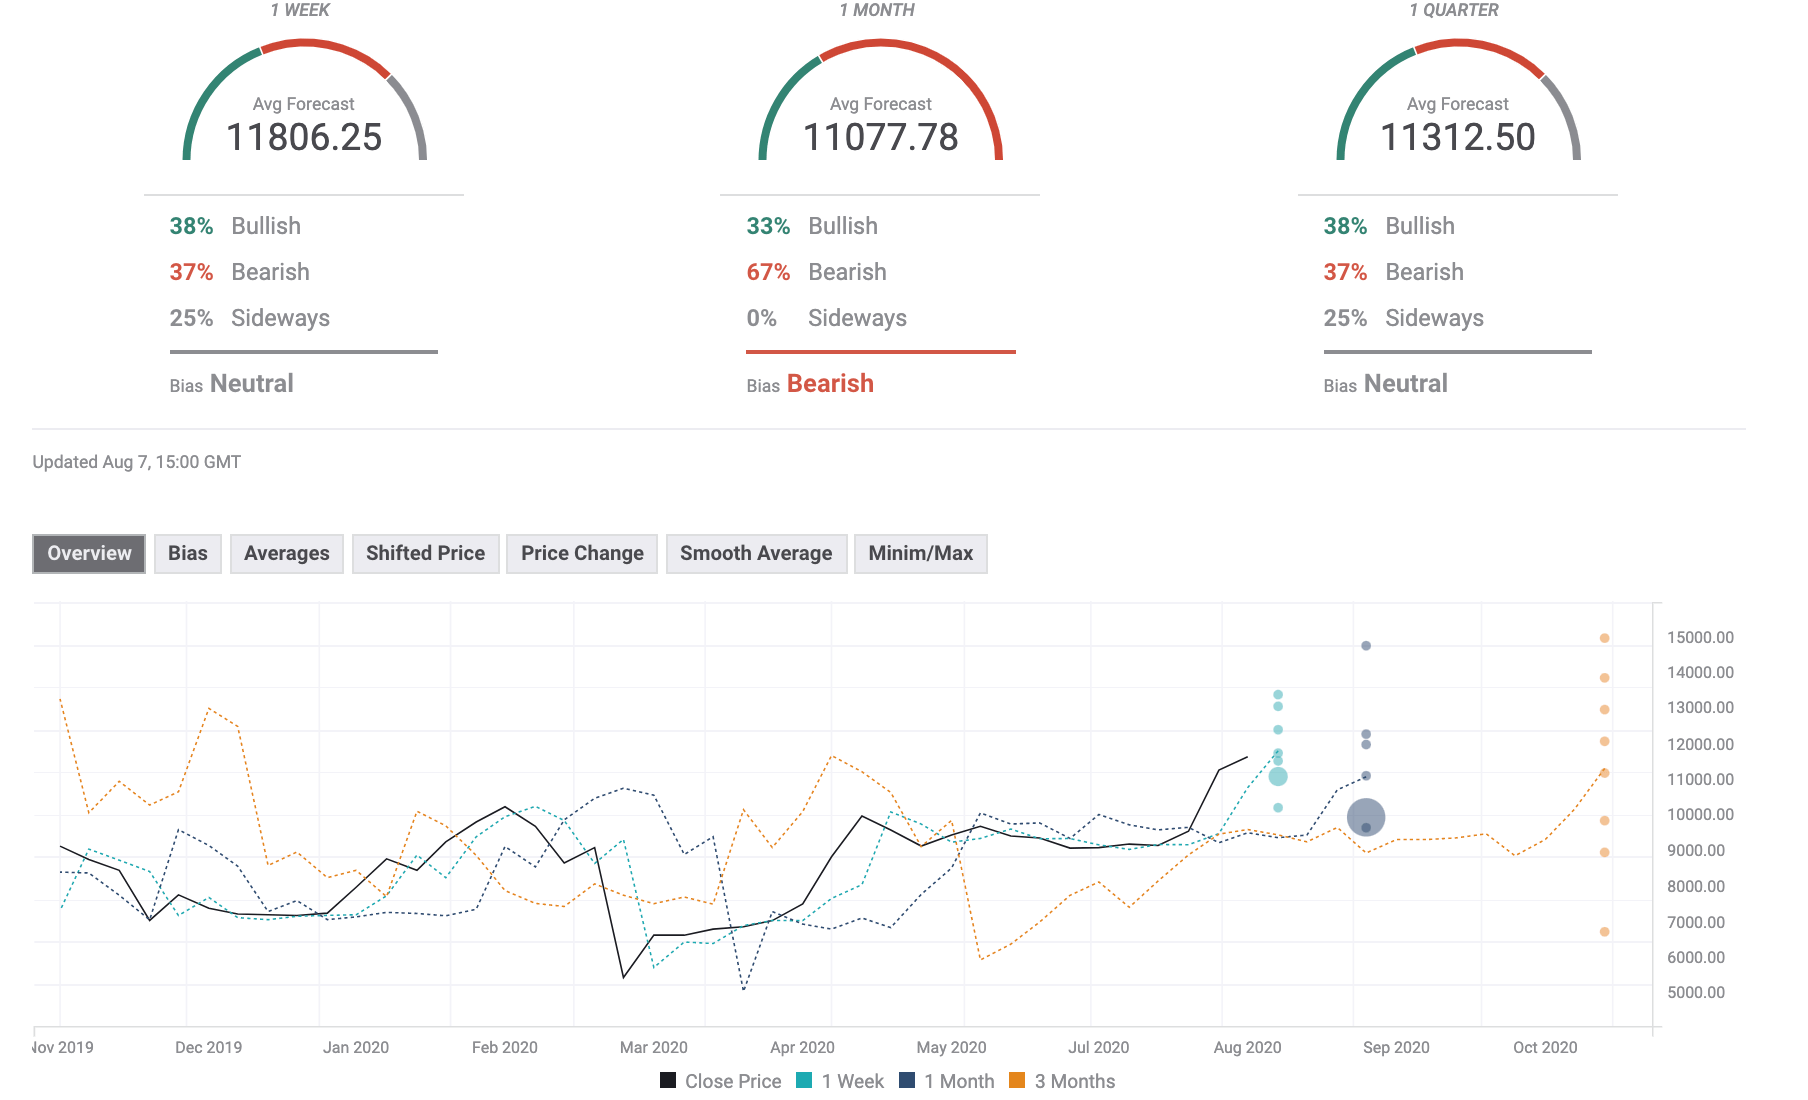
The Forecast Poll has worsened since the previous week as expectations on weekly and monthly timeframes are neutral. On a monthly basis, analysts expect the decline. Notably, the price expectations moved above $11,000, but stayed below $12,000. It means that the price may continue the sidelined trading in a new range, but the further breakthrough looks unlikely now.
Author

Tanya Abrosimova
Independent Analyst