Bitcoin Price Analysis: BTC poised to retest $10,500 before the growth resumed
- BTC/USD may extend the downside correction after a failed attempt to settle above $11,000.
- The decreasing exchange deposits imply that the long-term trend remains bullish.

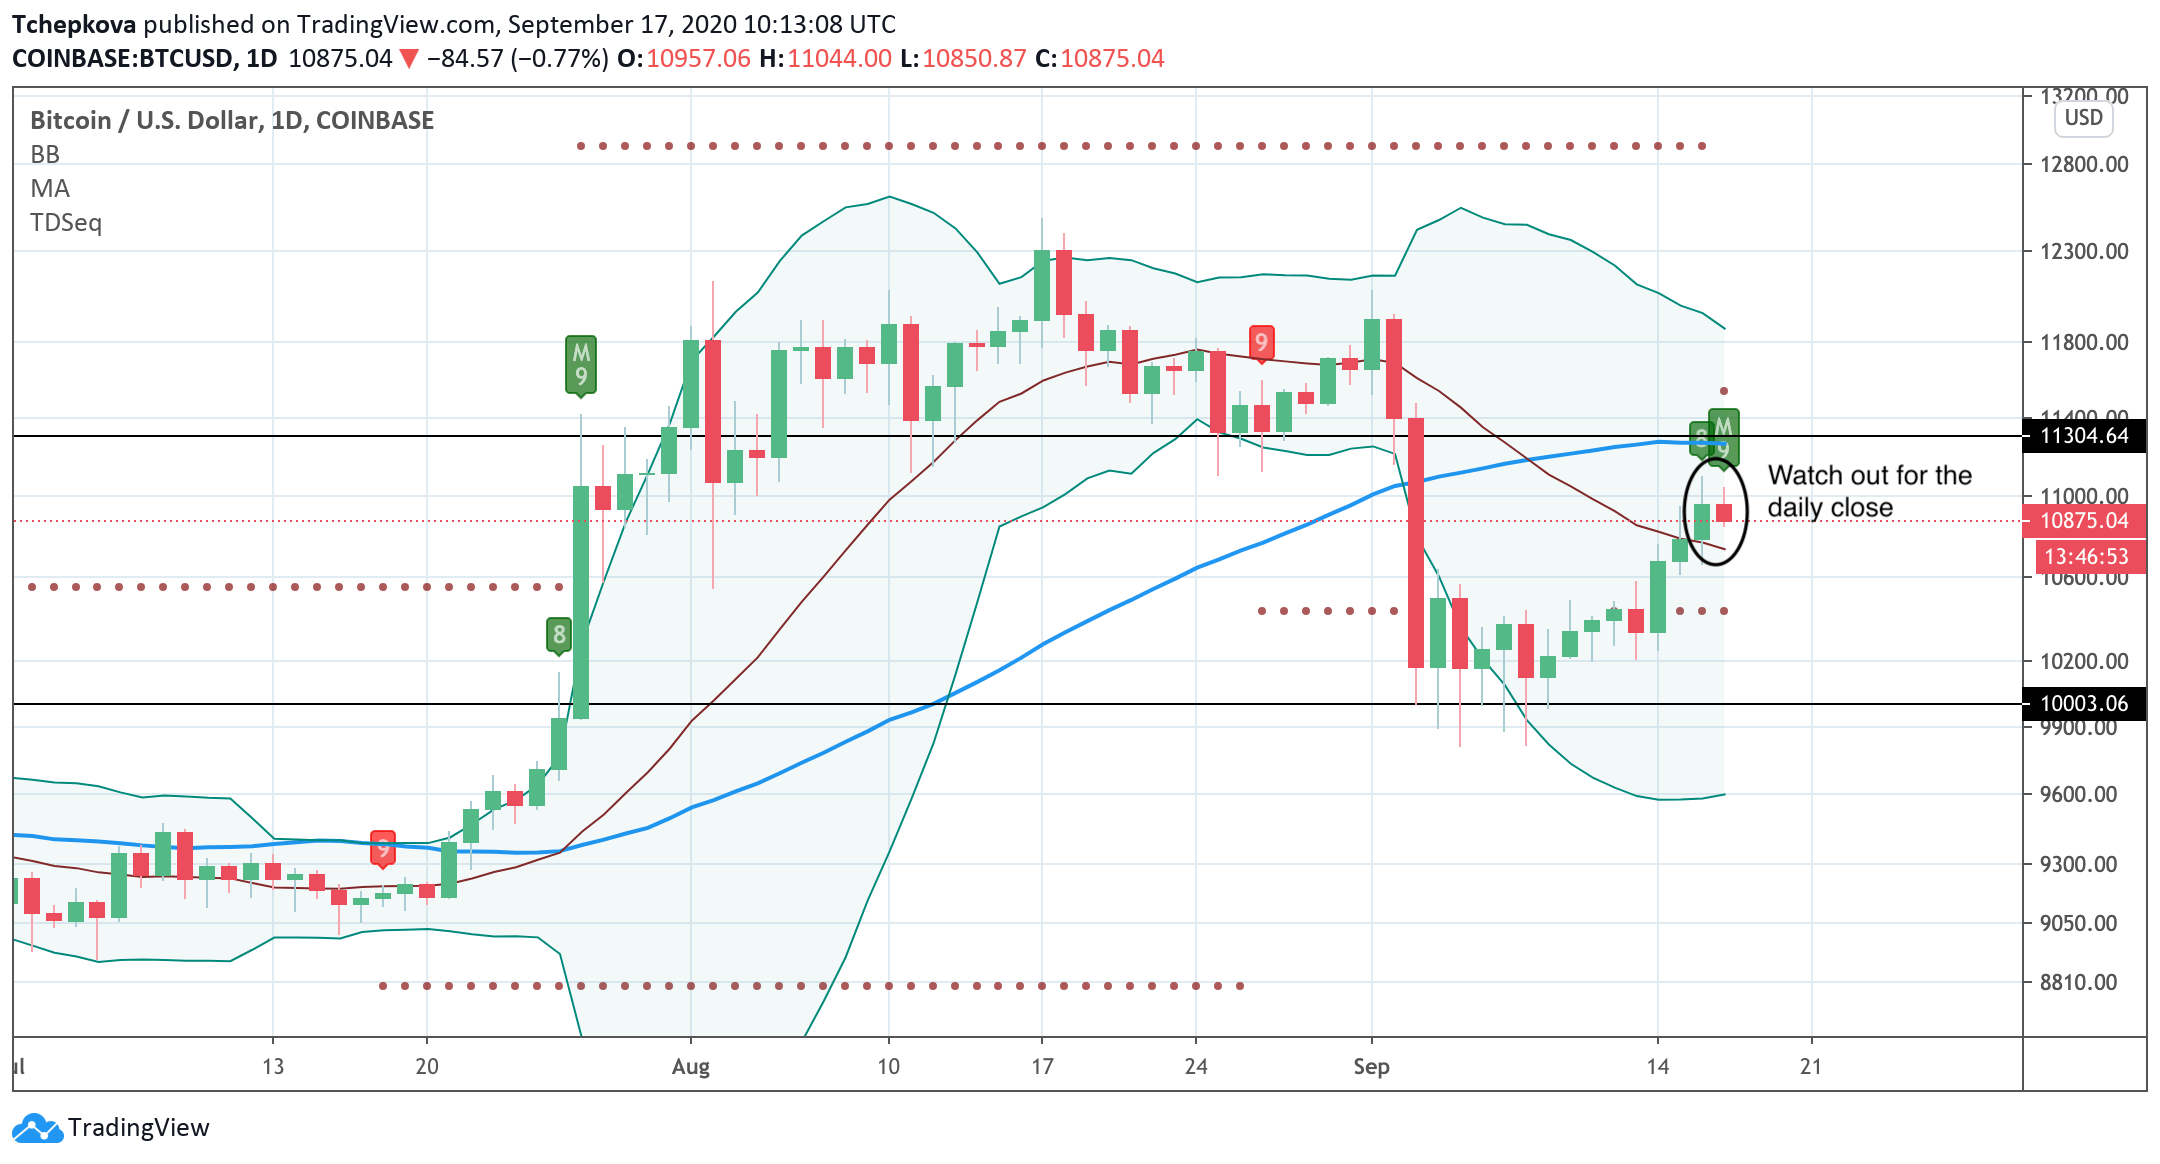
As we reported in our previous analysis, the TD Sequential indicator created a sell signal, which is now confirmed by the ninth bar and a developing bearish harami pattern. This candlestick formation consists of a long bullish candle followed by the second candle in the body of the first one. Once confirmed, this pattern will increase the probability of Bitcoin's downside reversal with the first target at $10,700 (the middle line of the daily Bollinger Band), and $10,500, the barrier that served as a strong resistance during the first and the second weeks of September.
The daily close above $11,000 (the daily high of September 16) will invalidate the bearish signal and bring more bulls to the market. Meanwhile, on the upside, the critical local resistance is created by the daily SMA50 on approach to $11,300. This area also served as strong support in August, making it a challenging barrier for the bulls.
BTC/USD daily chart
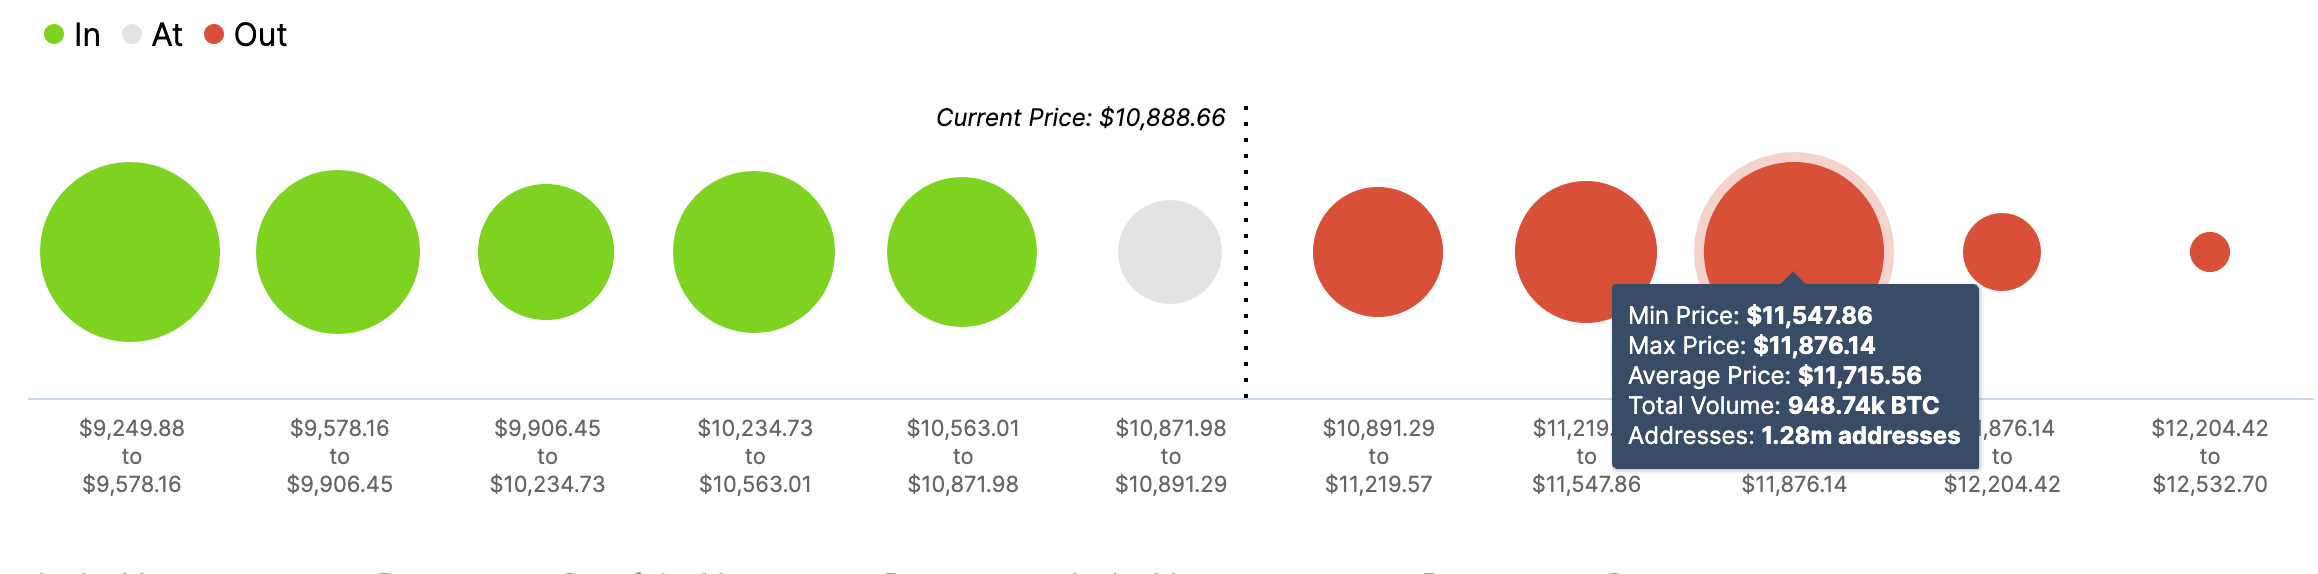
Intotheblock stats on the market positioning also implies that BTC bulls may face resistance on approach to $11,300. However, the ultimate barrier sits in the area $11,500-$11,800 as 1.28 million addresses holding nearly 1 million coins have a breakeven price within that price range. From the technical point of view, it is reinforced by the upper line of the daily Bollinger Band (as shown on the chart above). It will be hard to absorb the supply, though, once it happens, the way to the new highs of 2020 will be free.
The way to the downside is a bit more cluttered with the barriers, meaning that the way to the North is a path of least resistance for now. A wall of 1.28 addresses with over 700k coins protects $10,500 area. A similar supply is registered below $10,000.
Bitcoin's market positioning data
Source: Intotheblock
Bitcoin's on-chain metrics
The on-chain data sends alarming signals. Age consumed indicator used to predict the periods of sharp volatility has had the sharpest spike in a month, signaling that BTC may be ready to ride a roller-coaster. As shown in the graph below, the three previous spikes of the indicator led to increased market volatility in the direction opposite to the prevailing market movement.
Bitcoin's Age consumed
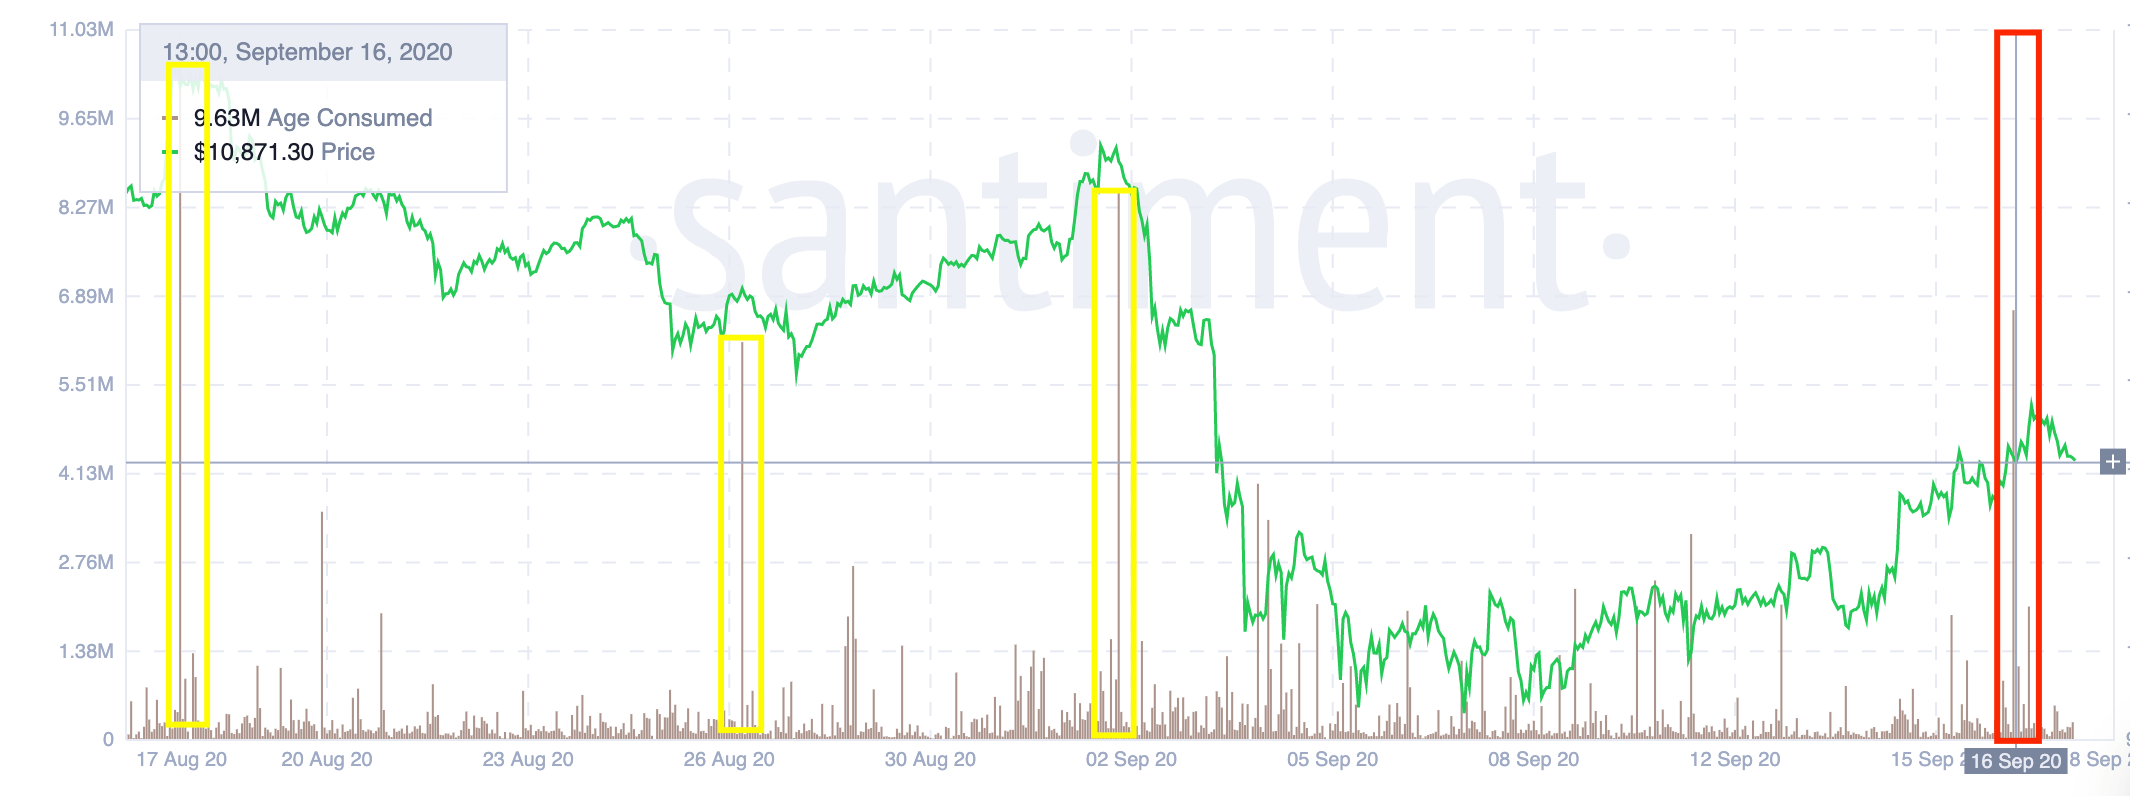
Source: Santiment
The data on holders distribution confirms the bearish setup as it shows that the large BTC owners are selling their coins. The number of whales with over 1,000 BTC in their wallets decreased from 2018 on September 11 to 2010 by the time of writing, meaning that big players leaving the network. Whales are notorious for their market impact as their transactions can trigger large price movements often intensified by cascade liquidation of leveraged speculative positions. As we have previously discussed, long-term BTC holders always win, while short-term traders are left to the mercy of their ups and downs.
Bitcoin's holders' distribution
 [12.44.45, 17 Sep, 2020]-637359399120946954.png)
Source: Santiment
BTC deposits at the exchanges near 2-year low
Meanwhile, the Arcane Research noticed that Bitcoin deposits at the cryptocurrency exchanges have been declining steadily and reached the lowest levels since November 2018. This is a potentially bullish signal as it means that traders are less inclined to sell and move their coins from the hot wallets for long-term storage.
The BTC deposits at major exchanges is still falling, and currently sits at its lowest levels since November 2018.
— Arcane Research (@ArcaneResearch) September 16, 2020
This could lead to a lower selling pressure going forward, as fewer hodlers are preparing to sell and realize profits.
Data: @glassnode pic.twitter.com/XgA1WEfrGN
To conclude, bitcoin's on-chain and technical indicators imply that the coin may resume the decline after a short-lived recovery on Thursday. The bearish harami pattern and TD Sequential sell signal are the most significant suggest that the market may not be ready for a decisive breakthrough just yet, and BTC/USD may retreat at least to $10,500. On the other hand, the decreasing deposits are typically a bullish signal, which makes us cautious. A sustainable move above $11,300 will invalidate the immediate bearish scenario and open up the way to the next barrier of $11,700.
Author

Tanya Abrosimova
Independent Analyst


