Bitcoin Weekly Forecast: BTC bulls can make or break 2023 rally
- Bitcoin price is at a critical point as it trades around $29,000.
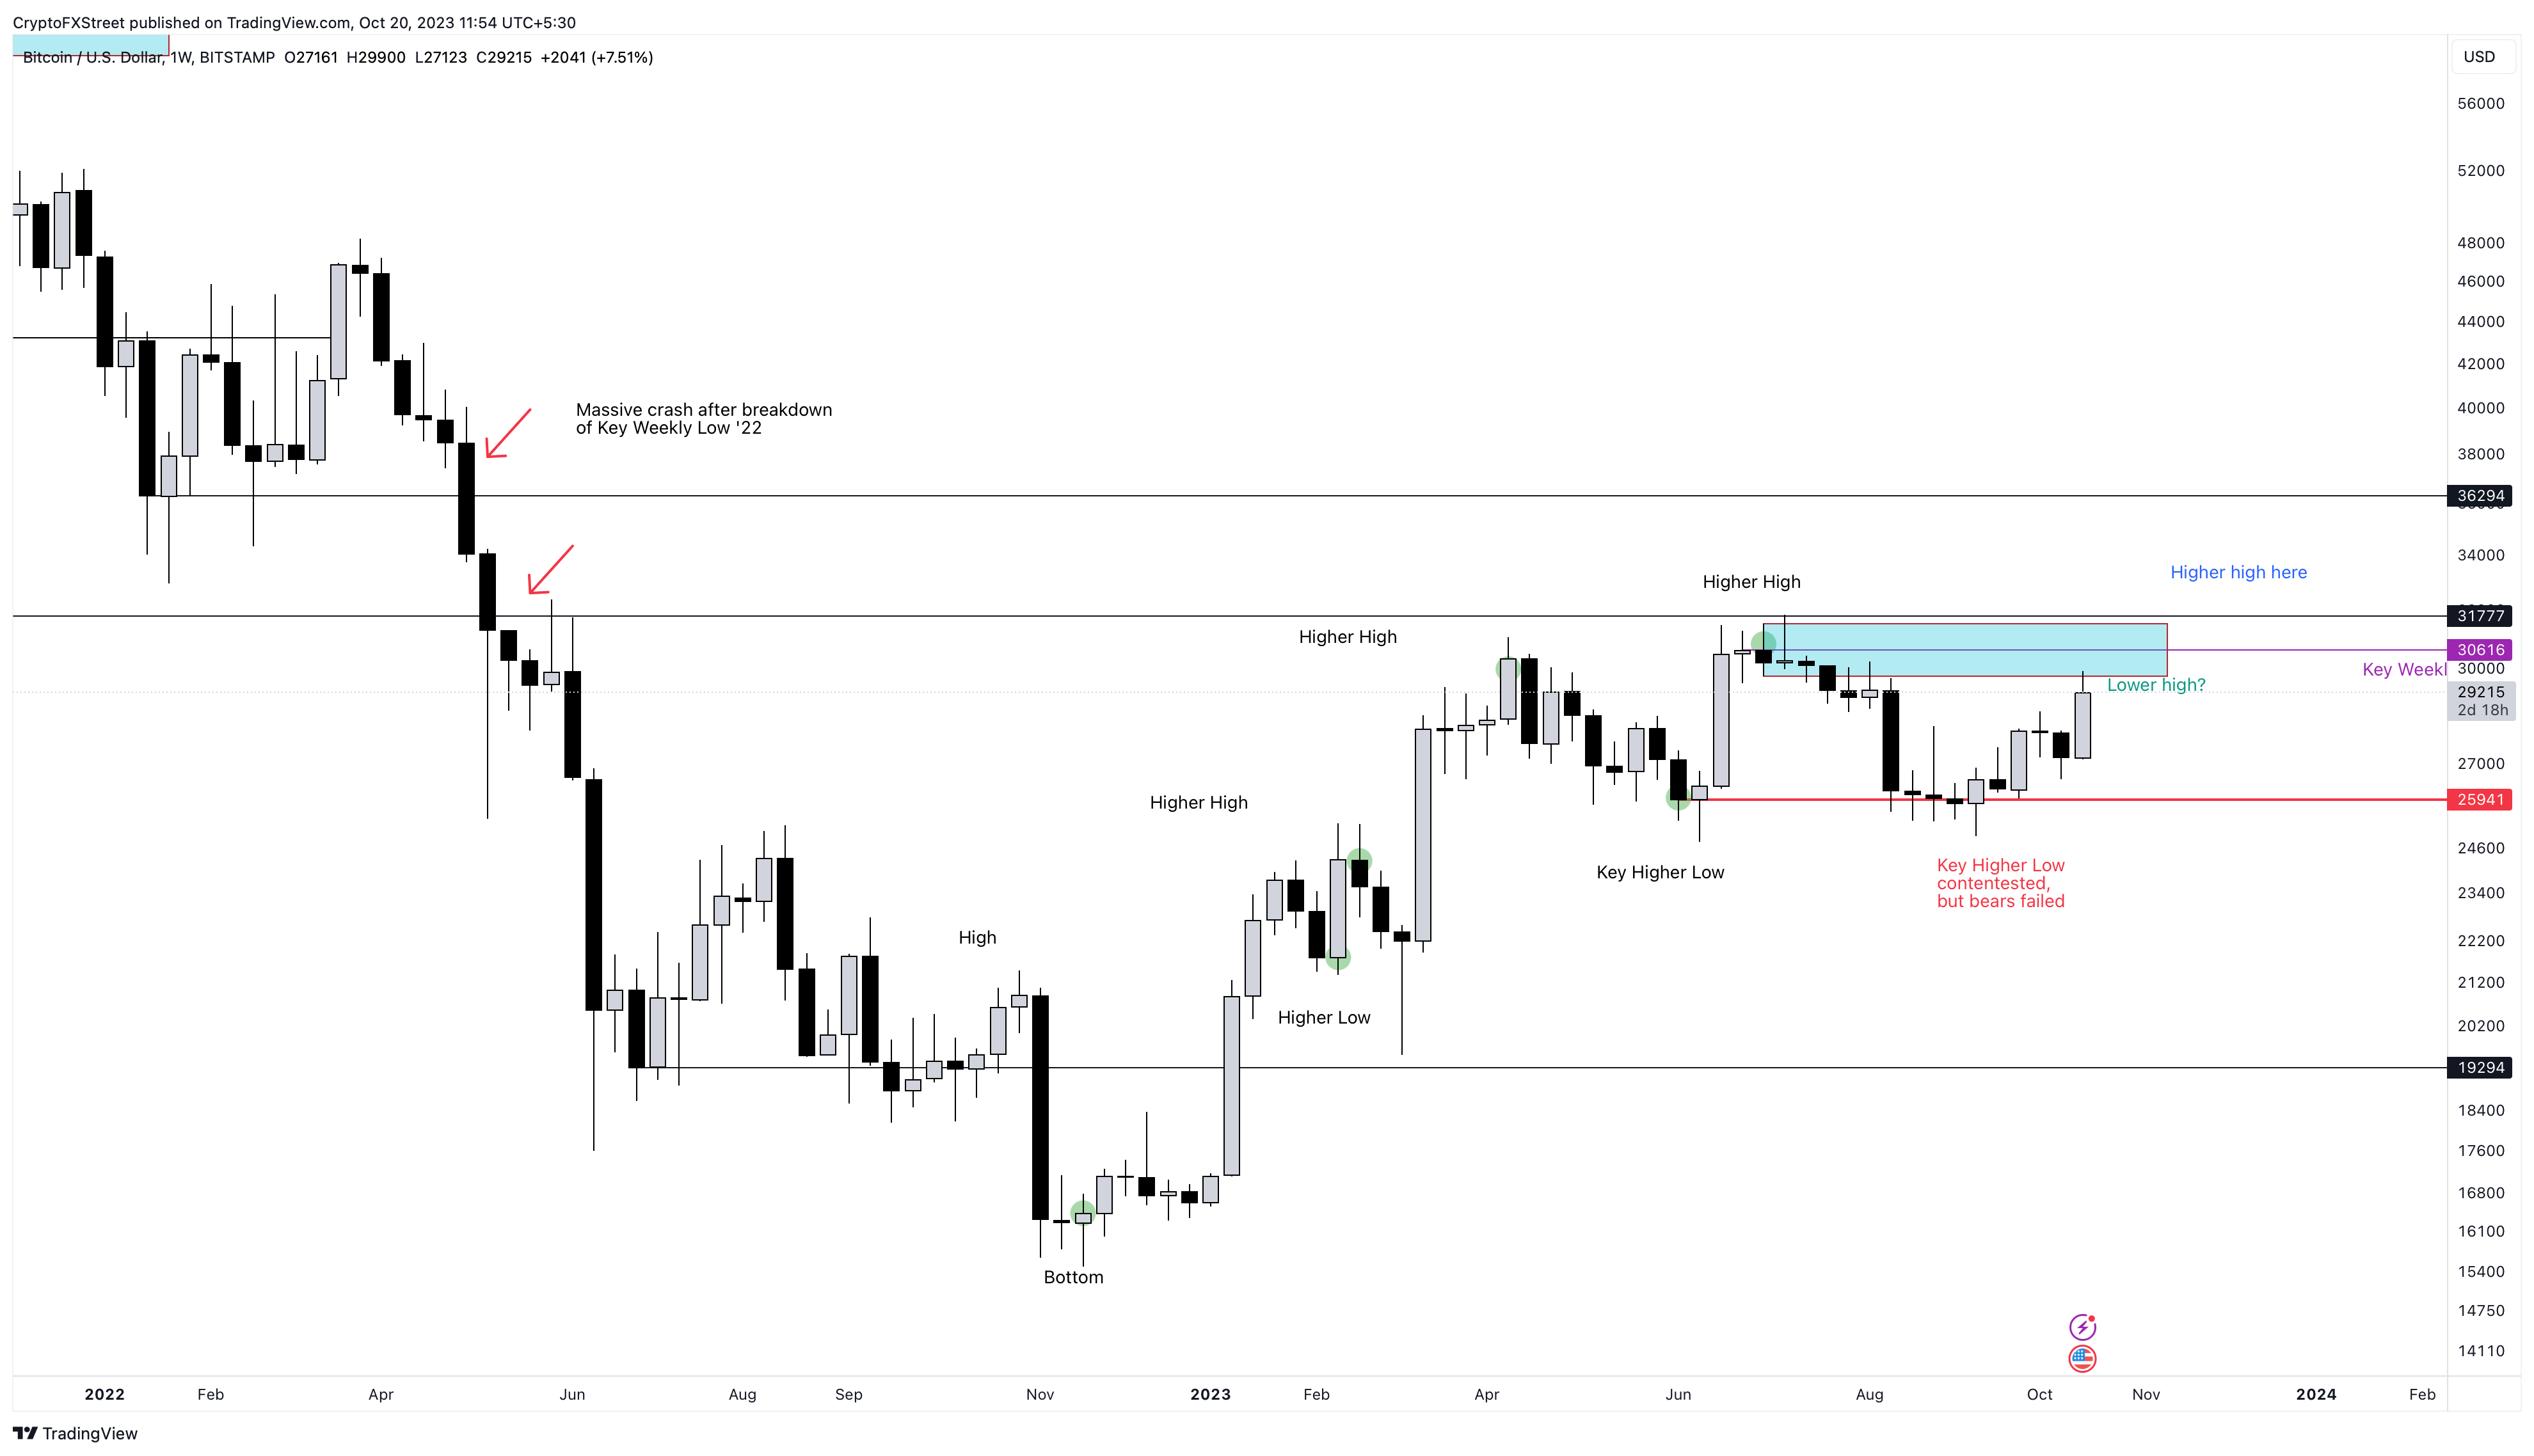
- A weekly candlestick close above $30,616 will create a new higher high, refueling the 2023 bull rally.
- But rejection around the $28,000 level that creates a lower high will add credence to the trend reversal scenario.

Bitcoin (BTC) price produced a lower low on August 28 on the weekly time frame. This move came after a sustained uptrend throughout 2023, which yielded 91.50% year-to-date returns. While some investors question the uptrend, others remain bullish. Only a small majority remains uncertain and are waiting for confirmation regardless of which side wins.
Also read: Bitcoin holdings of listed companies falls marginally in October
Bitcoin price at a critical point
Bitcoin (BTC) price has produced three distinctive higher highs and two higher lows in the last year. This uptrend, as mentioned above, has returned investors 91.50% at its peak of $31,818. But the exhaustion of momentum, coupled with profit-taking, pushed BTC down by nearly 21%. This correction created a lower low of $25,386 on the weekly chart relative to the previous weekly low of $25,941, which is the first condition for a trend reversal.
The second condition for a full-fledged downtrend would be a lower high. In this case, bears need to prevent BTC from producing a weekly candlestick close above the last key weekly higher high of $30,616. If bears are successful, it would satisfy all the conditions required for the start of a downtrend.
Last week, a major chunk of investors were expecting Bitcoin price to surely kickstart a downtrend. But the recent uptick in BTC has pushed it to trade around $29,000 – a two-month high –, which has reduced the odds of a downtrend, as more investors remain uncertain about the future.
Read more: Grayscale files for new spot Bitcoin ETF on NYSE Arca
BTC/USDT 1-week chart
Also read: Bitcoin-to-Gold Ratio more than halves between 2021 and 2023
Where will BTC go next?
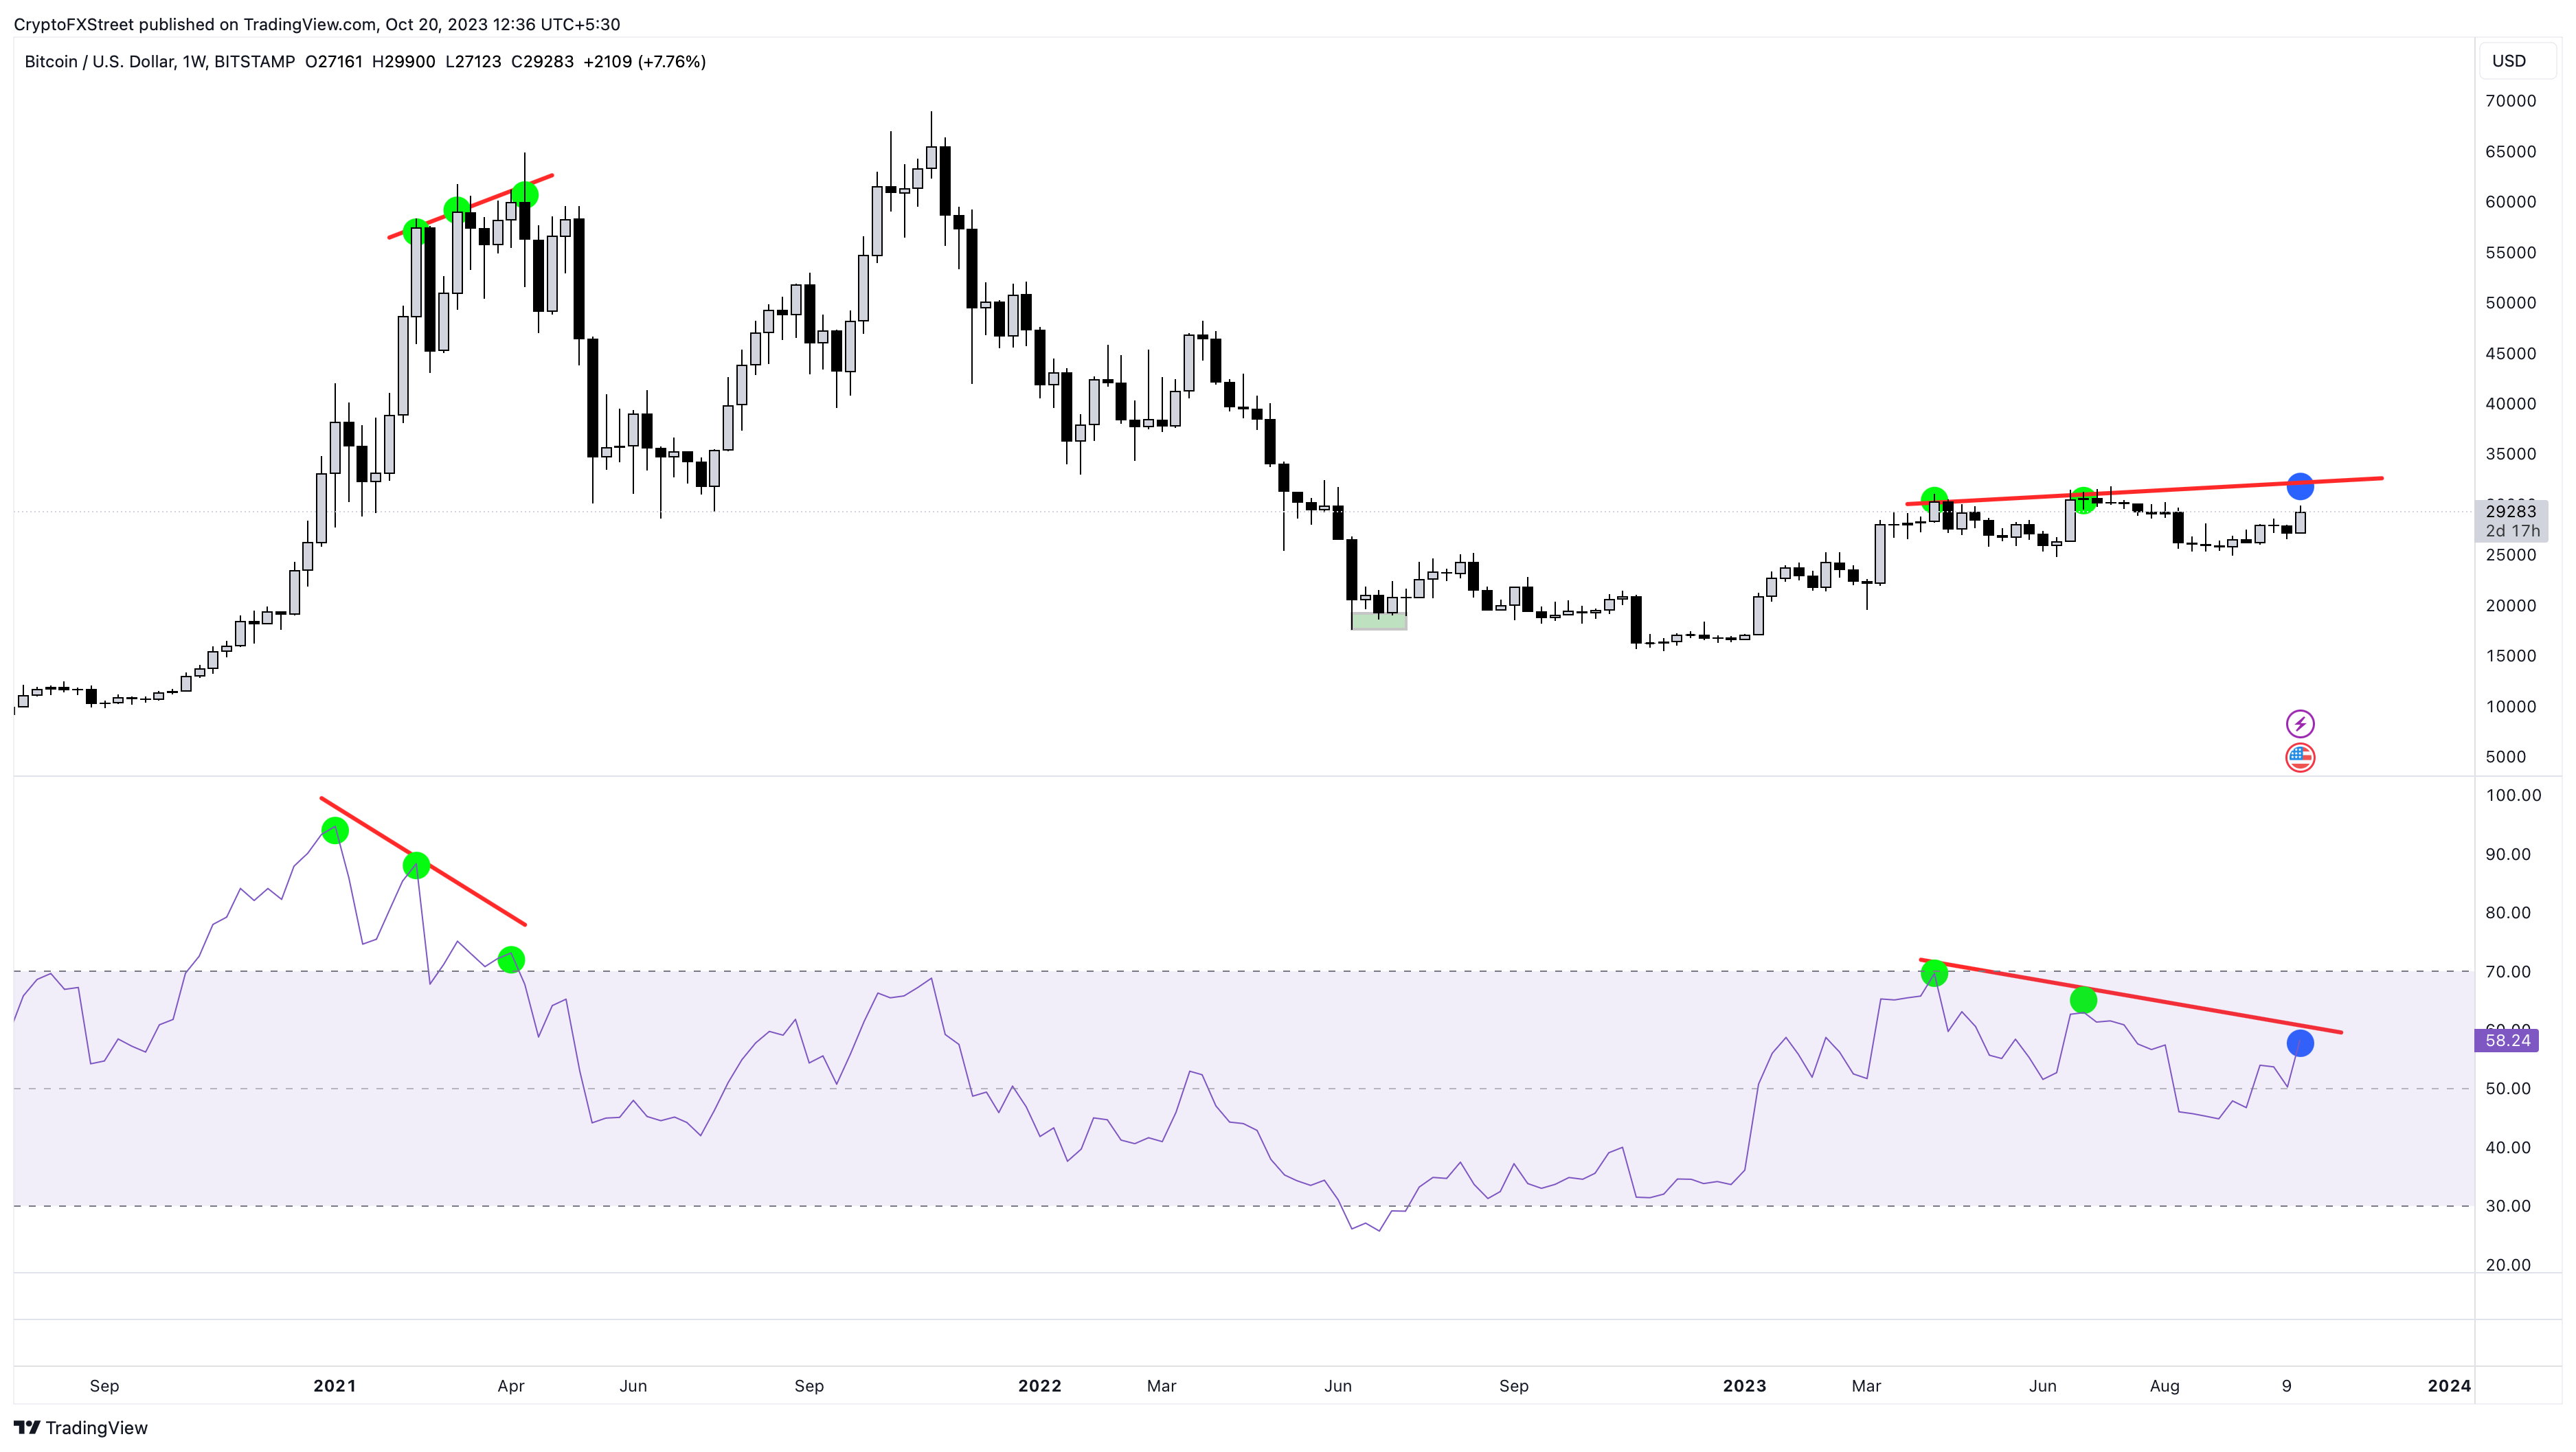
The weekly Relative Strength Index (RSI) has bounced off the mean level of 50, suggesting that bulls have an equal chance of making a comeback. The Awesome Oscillator (AO) is very close to flipping the zero mean level. The last time AO successfully flipped the zero level was in early 2023, when Bitcoin kick-started a bull rally. If history were to repeat, the RSI is already in place to support such a move.

BTC/USD 1-week RSI and AO
But will Bitcoin price successfully kickstart an uptrend?
Based purely on historical data, the answer is a resounding yes. The historical monthly returns for Bitcoin price for the past 12 years suggest that November is the highest returning month. Following which are April and October.
Additionally, the fourth quarter is the highest quarter, with a 93.38% return
So, the chances that Bitcoin price continues to rally and sustain its 2023 rally are high.

BTC monthly, quarterly returns
On-chain metrics suggest trend exhaustion
While technicals might be reporting remnant momentum, on-chain metrics reveal potential correction. The 7-day and 30-day Market Value to Realized Value (MVRV) show that the recent uptick in Bitcoin price might have pushed these indicators into danger zones.
This index is used to determine the average profit/loss of investors who purchased BTC over the past week and month. Currently, the 7-day MVRV sits at 3.53%, which denotes that 3.53% of all investors that purchased BTC in the past week are in profit. Likewise, the 30-day MVRV reports that nearly 6% of holders are in profit.
Based on historical data, both the 7-day and 30-day MVRV indicators are at “danger zones.” These key areas are where investors are likely to book profits and trigger corrections, albeit for the short term.
If history repeats, the correction could further help bears satisfy the second condition of trend reversal and produce a lower high.
 [12.10.17, 20 Oct, 2023]-638333838085848442.png)
BTC 7-day and 30-day MVRV
Furthermore, the daily active addresses are on the decline after peaking at 1.23 million on September 15. Apart from random spikes in on-chain volumes, the outlook for BTC from an on-chain perspective is bleak.
 [12.13.15, 20 Oct, 2023]-638333838532706892.png)
BTC daily active addresses
Concluding Thoughts
A closer look at the weekly chart shows that when Bitcoin price produced higher highs in April and July, the RSI failed to follow through, creating a bearish divergence. This technical formation often leads to a decline in the underlying asset. In Bitcoin’s case, it led to a 20% correction that created a lower low in September. But if BTC does produce a third higher high with RSI continuing to produce lower highs, it would confirm a triple bearish divergence.
BTC/USD 1-week chart
While this top-formation pattern is a common occurrence in the cryptocurrency landscape, it would accomplish two moves: cull early bears and attract more bulls to position themselves to the upside.
So when Bitcoin price does slide lower, it would have already caused a ton of short liquidations, but now, greedy longs will also be liquidated. This would be a perfect storm to kickstart a downtrend.
- In the case of a downtrend, Bitcoin price is likely to find support at the $25,000 level. A breakdown of this could trigger a volatile correction to $19,300,
- If bulls are successful in creating a higher high and ETF hype piles on, then Bitcoin price could revisit the $31,777 hurdle. A flip of the said level into a support floor could send BTC to $36,294.
To top it off, the PCE Price Index on October 27 and the Federal Reserve’s interest rate decision on November 1 are two key macroeconomic events for traders. These events have the ability to shape either of the trends discussed here.
Author

Akash Girimath
FXStreet
Akash Girimath is a Mechanical Engineer interested in the chaos of the financial markets. Trying to make sense of this convoluted yet fascinating space, he switched his engineering job to become a crypto reporter and analyst.


