Bitcoin Weekly Forecast: BTC bounces back toward $50,000 after FUD-induced crash
- Bitcoin price is currently attempting to break out from the falling wedge pattern.
- The debate on crypto regulation takes a new direction as BTC adoption continues to rise.
- On-chain metrics suggest the worst may be behind the bellwether crypto.

Bitcoin price suffered two fatal corrections on September 7 and September 20. However, the buyers stepped in, giving bears a run for their money, leading to consolidation. The buyers appear to have taken control of the ship and likely aim to break out from a bullish pattern.
Bitcoin suffers but never forgets to make a comeback
Bitcoin price took a massive hit on September 20 as the news of China banning cryptocurrencies spread like wildfire. The People’s Bank of China (PBOC) posted a circular that tightened the noose around mining and cracked down on the mining gray areas.
Additionally, the note mentioned a list of illegal activities like trading cryptocurrencies. It also noted that it would implement preventive measures to identify and ban hype around digital assets.
The recent development is not the first time China has banned Bitcoin and other cryptocurrencies. In fact, there have been roughly 12 bans from the country over the past decade.
While China continues to close doors on the burgeoning ecosystem, Tesla CEO Elon Musk stated that the cryptocurrency space must be left alone during a recent interview. He added,
It is not possible to, I think, destroy crypto, but it is possible for governments to slow down its advancement
Unlike China, the US is embracing crypto, albeit slowly. El Salvador, the country that made BTC legal tender, is making progress on this front. President Nayib Bukele has teased Bitcoin mining using volcanic geothermal energy.
First steps...
— Nayib Bukele (@nayibbukele) September 28, 2021
#Bitcoin pic.twitter.com/duhHvmEnym
This update from the President comes after the country adopted BTC as a legal tender in June.
Bukele first mentioned the use of volcanoes to mine Bitcoin. He said that the engineers are starting to design a hub around the volcanoes as he added,
Our engineers just informed me that they dug a new well, that will provide approximately 95MW of 100% clean, 0 emissions geothermal energy from our volcanoes.
Bitcoin price attempts to fly
Bitcoin price set up three distinctive lower highs and lower lows since August 26. Connecting these peaks and troughs using trend lines shows the formation of a falling wedge.
This technical formation forecasts a 12% upswing to $49,725, determined by adding the distance between the first swing high and swing low to the breakout point at $44,192. Just to be sure, investors can wait for a decisive close above $44,893 to confirm the start of an uptrend.
However, this bullish outlook applies to the short-to-medium-term time frame. For the long-term scenario to flip, BTC needs to produce a higher high above $53,000 to make a run at the all-time high at $64,951.
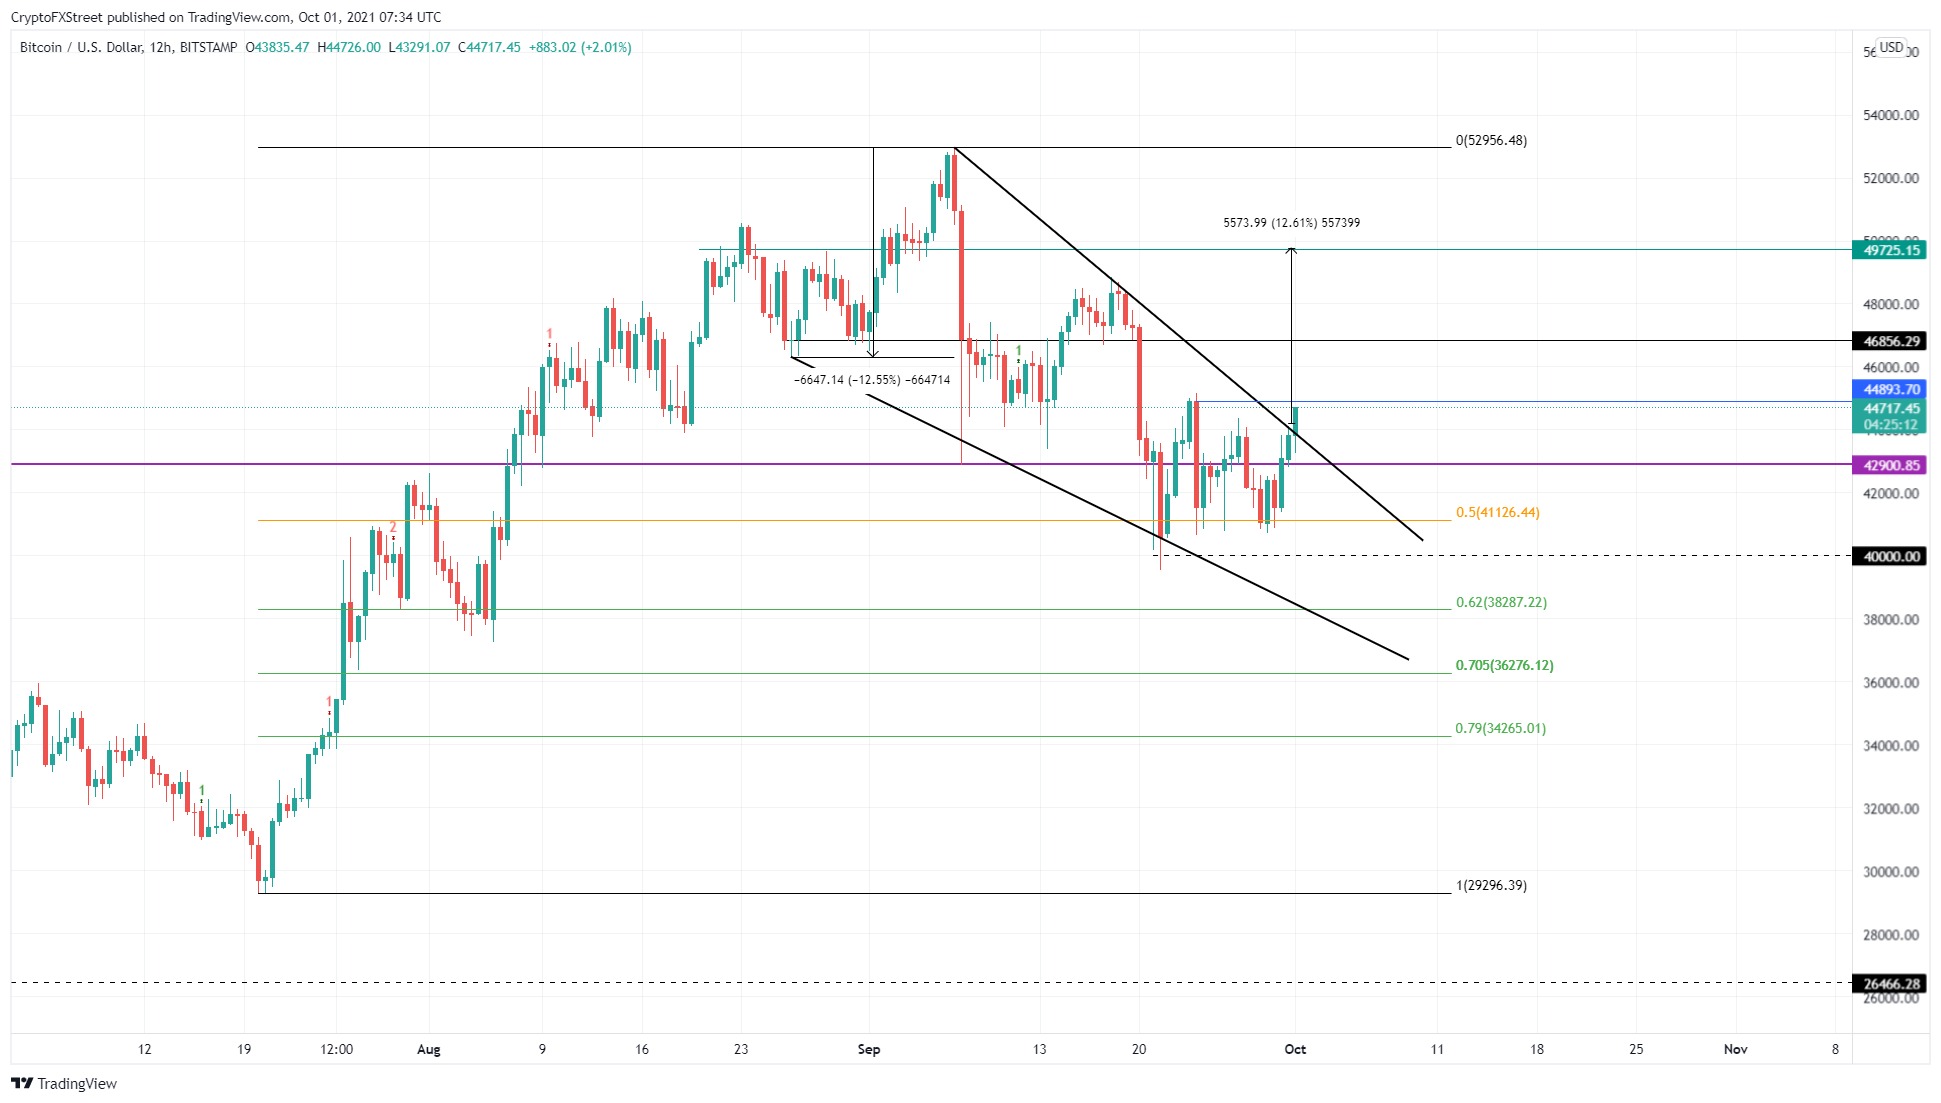
BTC/USDT 12-hour chart
The 365-day Market Value to Realized Value (MVRV) model supports this Bitcoin price action, which has tagged the zero line again, suggesting that the holders are neutral. Therefore, the possibility of a sell-off that catches investors off guard is close to zero.
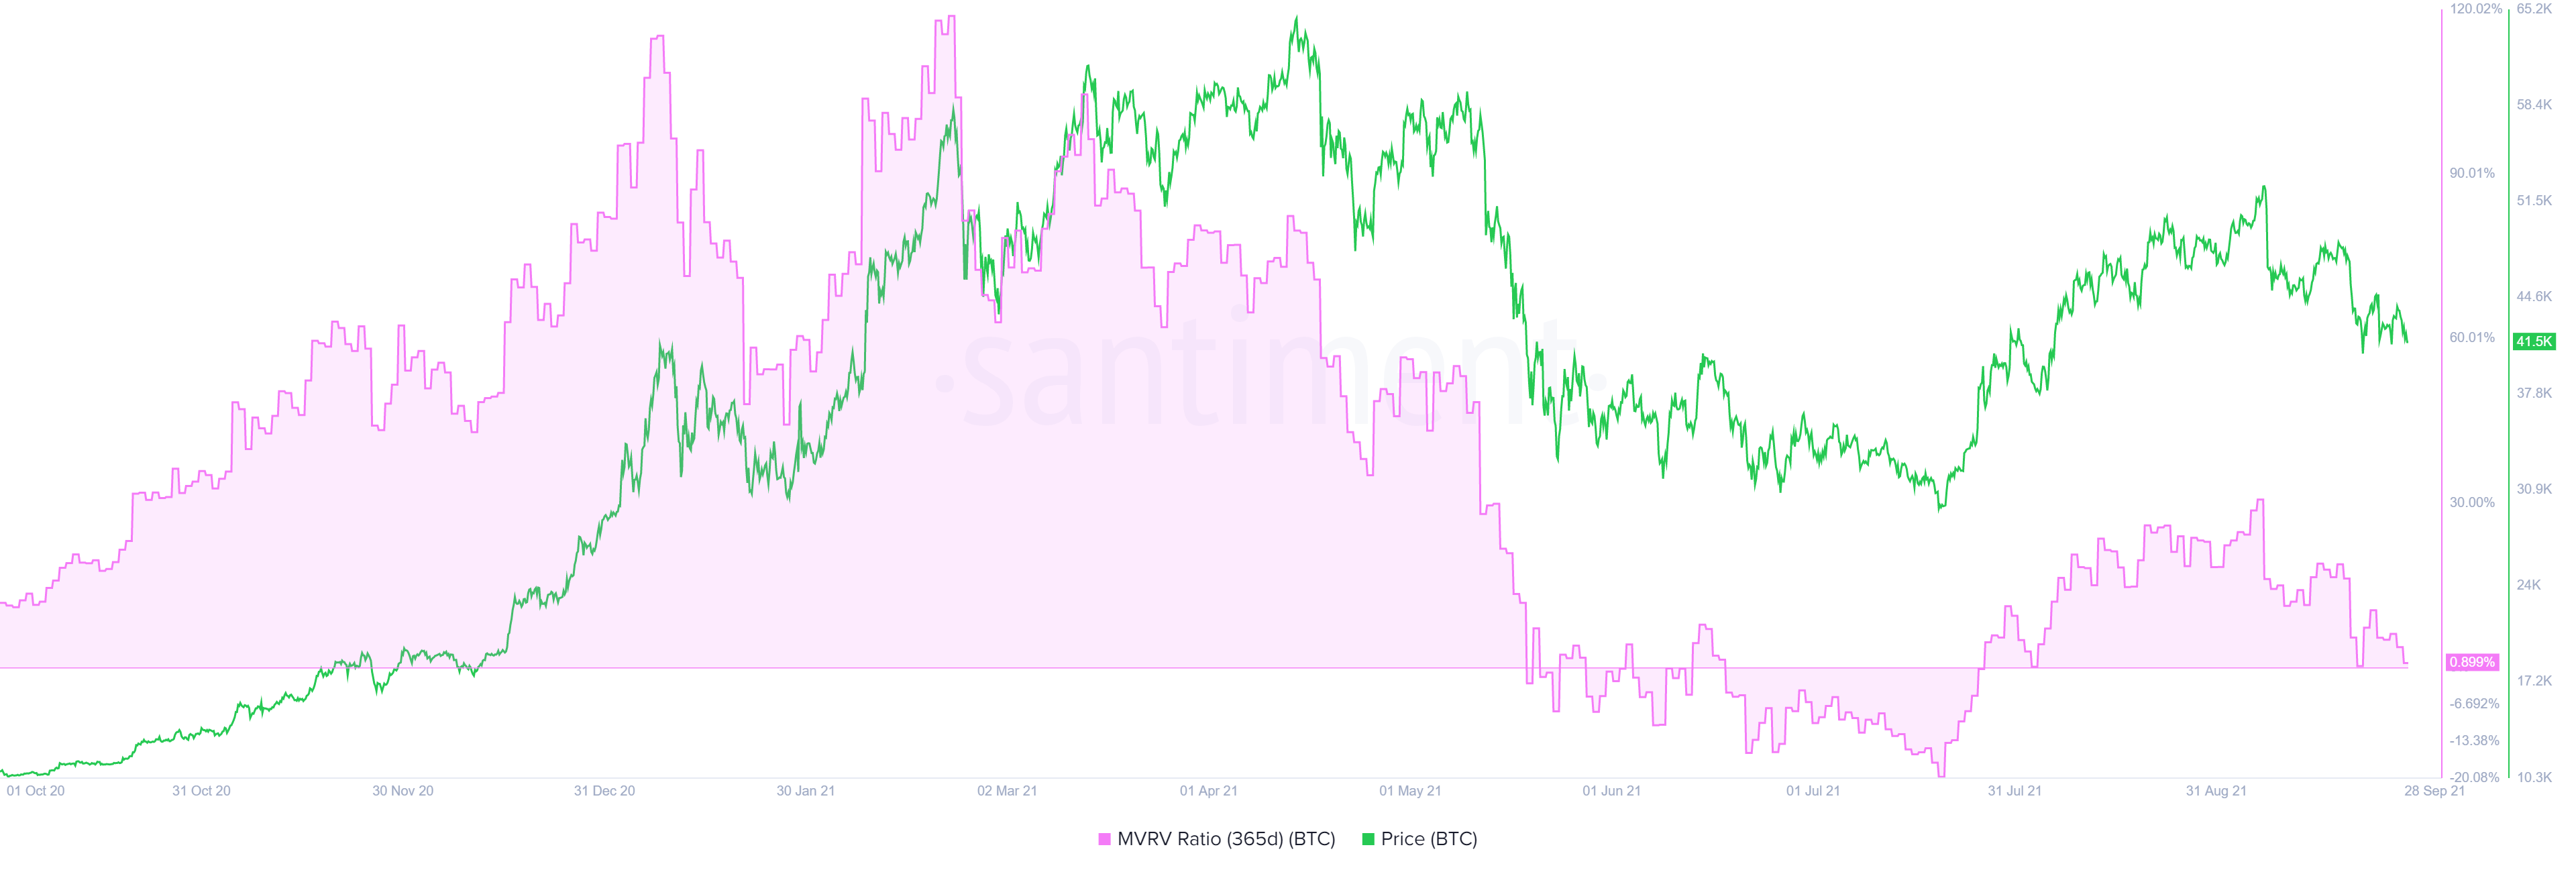
BTC 365-day MVRV chart
Further building confidence in the lack of a sell-off scenario is the Net Realized Profit/Loss (NRPL) indicator. This metric reads a negative $43.44 million, indicating the panic sellers have already sold their holdings for a loss, suggesting that a further sell-off is highly unlikely.
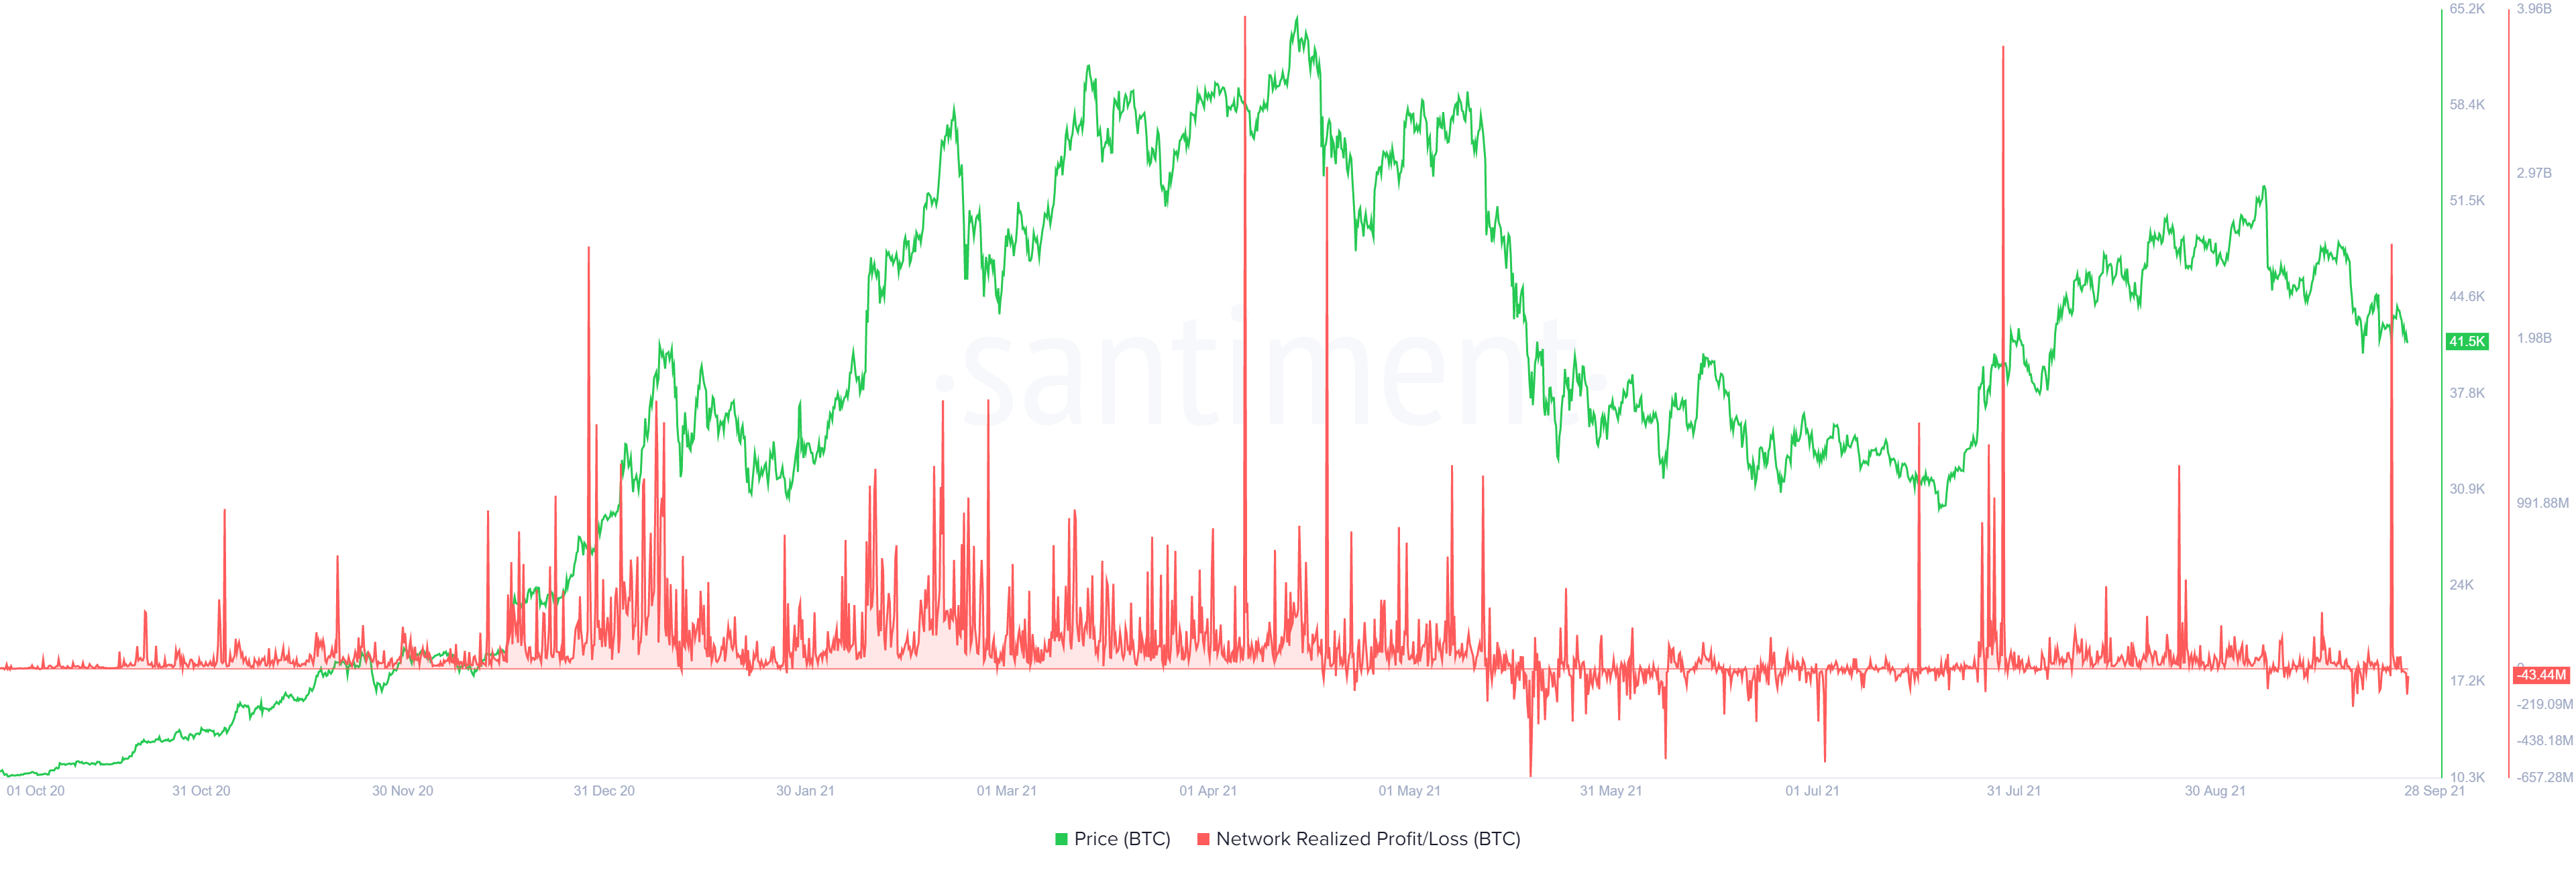
BTC NRPL chart
Nosediving deeper every day is the supply of BTC on exchanges, which shows the confidence among investors who are withdrawing their BTC from centralized entities and storing it in cold wallets in anticipation of a bull run.
Roughly 180,000 BTC have flowed out of hot wallets since September 1, further adding credence to the bullish outlook.
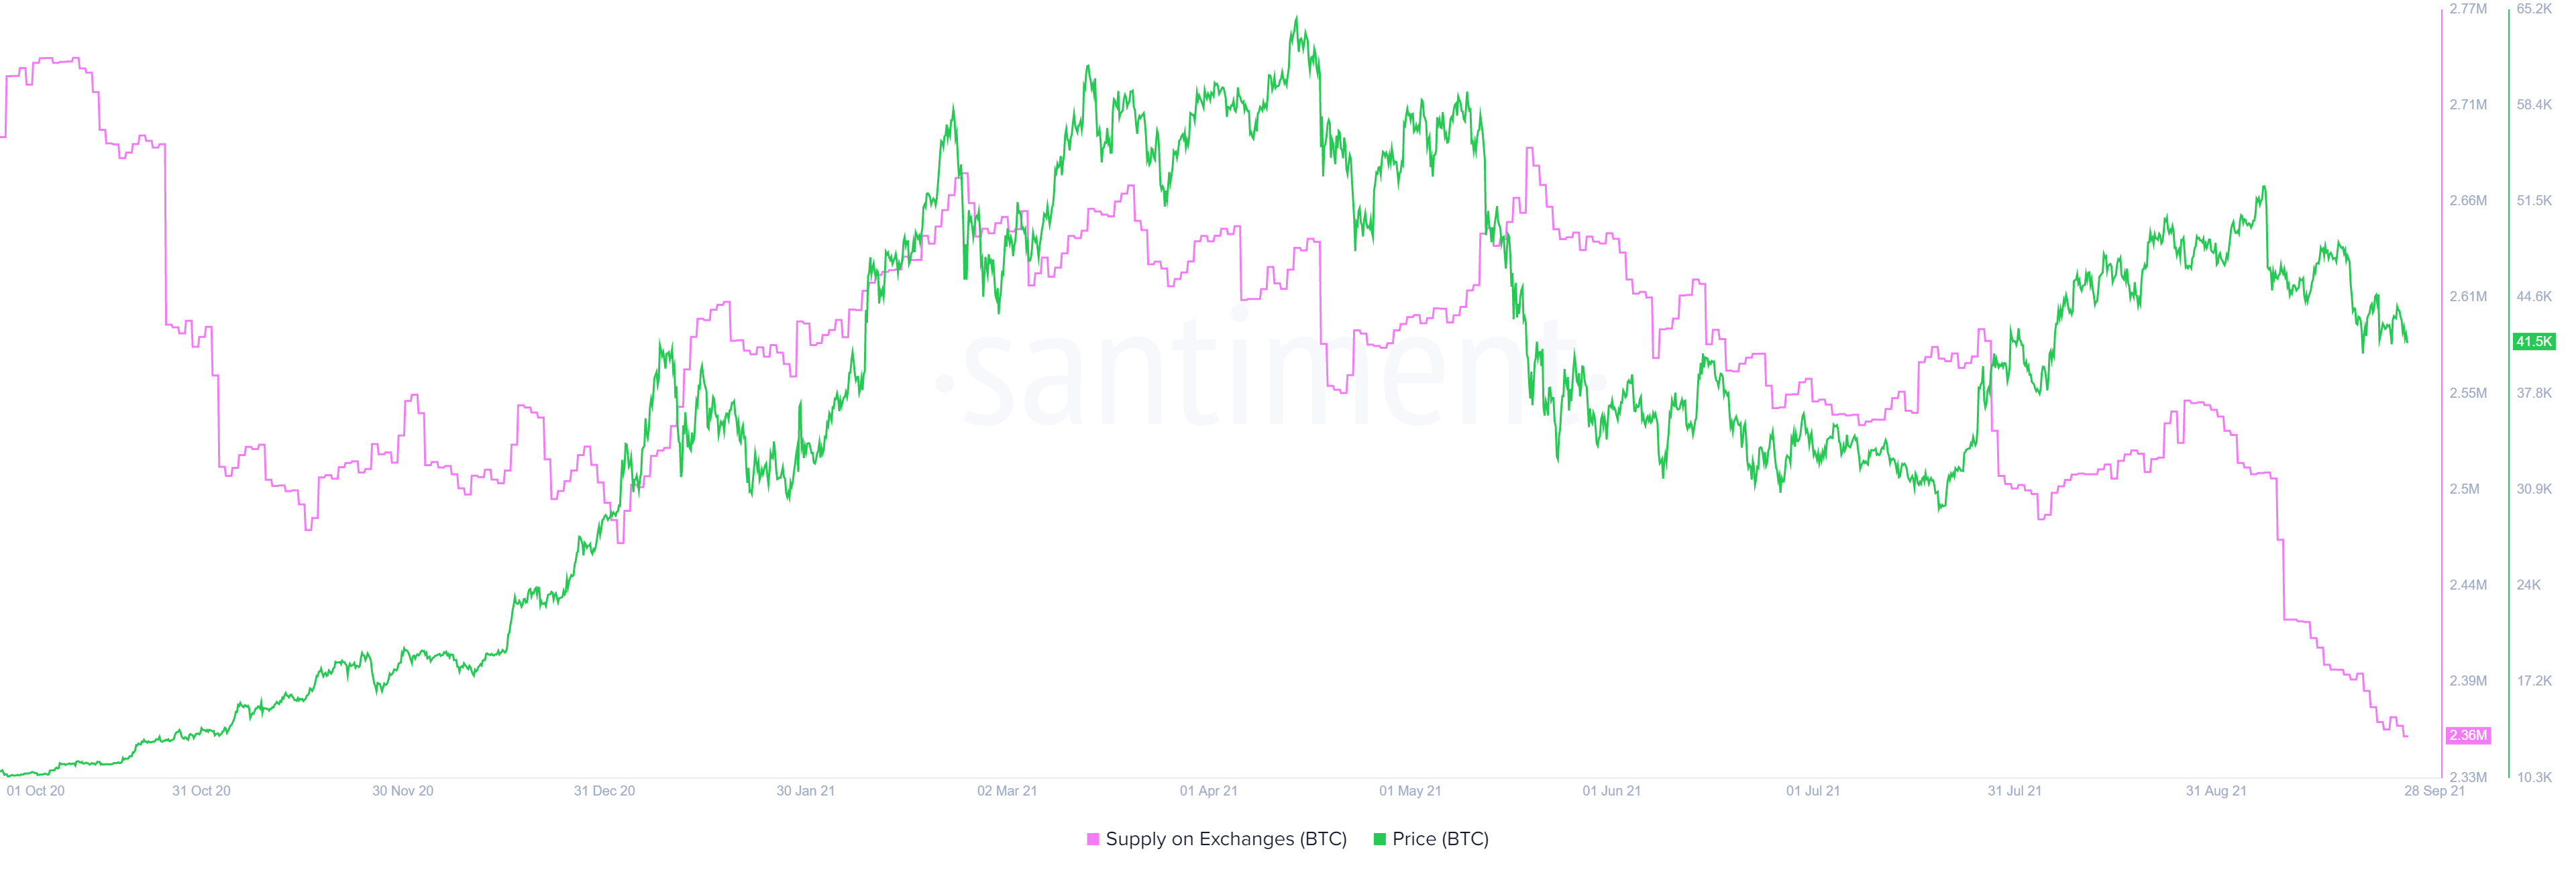
BTC supply on exchanges chart
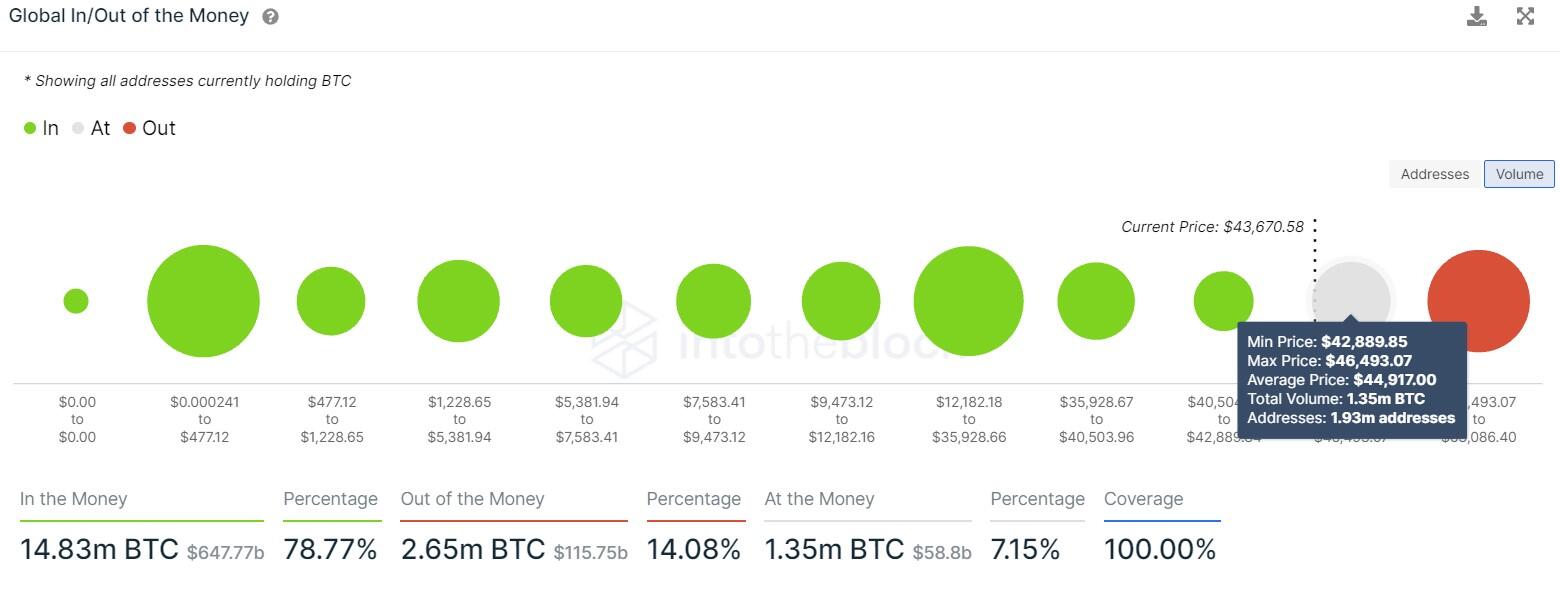
IntoTheBlock’s Global In/Out of the Money (GIOM) model shows that Bitcoin price is already taking over the immediate resistance level at $44,917. Here roughly 1.93 million addresses purchased approximately 1.35 million BTC.
A convincing close above $45,000 will convert a majority of these investors to profitability lessening the selling pressure and helping propel BTC to $50,000 or $53,000.
BTC GIOM Chart
On the other hand, a rejection at the upper trend line of the falling wedge could pose trouble for Bitcoin price as it would indicate either an increased selling pressure or the inability of the buyers to push through.
If this downswing pushes Bitcoin price below $40,000, it will invalidate the bullish thesis and potentially trigger a crash to 70.5% Fibonacci retracement level at $36,276. Here, the bellwether cryptocurrency could attempt to restart the uptrend or head lower.
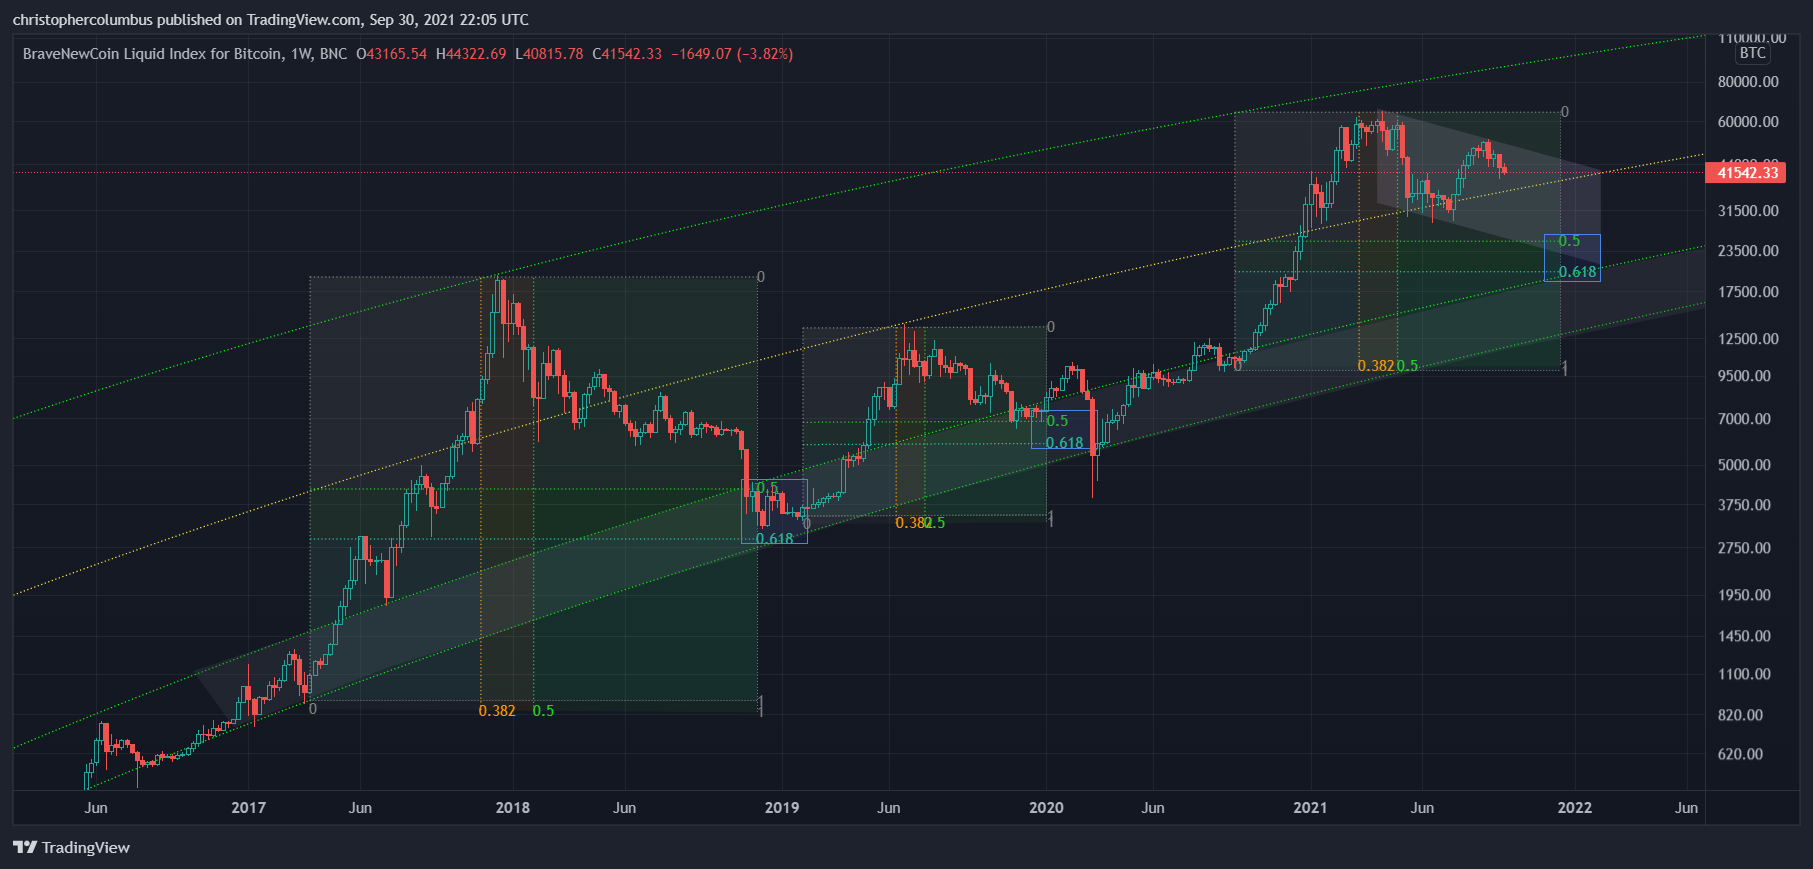
While this bearish take on Bitcoin is from a short-term perspective, a popular Twitter analyst who goes by the screen name “davethewave” anticipates a much steeper correction.
According to them, BTC’s retracement could develop into an extended correction from a historical perspective. Based on their charts, BTC typically bottoms between the 50% and 61.8% Fibonacci levels.
According to “davethewave”, this bottoming process was seen in 2017 and 2018 and could repeat in 2021. Based on this data, BTC could head anywhere between $20,000 to $25,000.
BNC 1-week chart
“davethewave” further speculates why this bearish outlook might not arrive as he plays the devil’s advocate. He adds,
Yet another consideration is the changing dynamic of this market - just as the blow-off top was absent this time around, so too might that capitulation spike to the downside be in the near future.
While the short to mid-term outcome looks bearish, it will become inconsequential considering the surge in Bitcoin adoption and its ever growing fundamentals.
Author

Akash Girimath
FXStreet
Akash Girimath is a Mechanical Engineer interested in the chaos of the financial markets. Trying to make sense of this convoluted yet fascinating space, he switched his engineering job to become a crypto reporter and analyst.




