Bitcoin Weekly Forecast: Breaking down key BTC levels to accumulate for Q2, 2023
- Bitcoin price looks bullish on the weekly and monthly timeframes, suggesting that a continuation of the bull trend is likely.
- Key levels to the upside include $35,000 and $38,500.
- Invalidation of the bullish thesis will occur on the flip of the $20,200 level.

Bitcoin price shows an interesting outlook as the first quarter of 2023 comes to an end. BTC has shown strength since day one of 2023 and has netted investors approximately 70% in returns. This article will break down key support levels and hurdles for the second quarter of 2023.
Read more: Top 3 Price Prediction Bitcoin, Ethereum, Ripple: Altcoins flourish as BTC remains rangebound
Bitcoin price and historical returns
Before jumping into Bitcoin price, let us take a look at the historical quarterly returns for BTC. The quarterly return for the pioneer crypto is hovering around 68%, which makes it the 2nd biggest performance since 2021.
General observation shows that if the quarter one (Q1) returns are negligible, Bitcoin price shows enthusiasm and rallies in the next quarter. However, a greater than 20% return in Q1 is generally followed by a retracement or pullback in the next quarter.
Therefore, investors need to be cautious of a potential correction.
When looking at data that extends back to 2014, readers can observe that although the average return of BTC in Q1 2023 is 5.91%, quarter two has an average return of 32%. Clearly, there is a change in the narrative this year owing to the worsening macroeconomic conditions and multiple bank runs.
If ex-Coinbase CTO’s prediction about hyperbitcoinization comes to life, then Bitcoin price could spike higher.
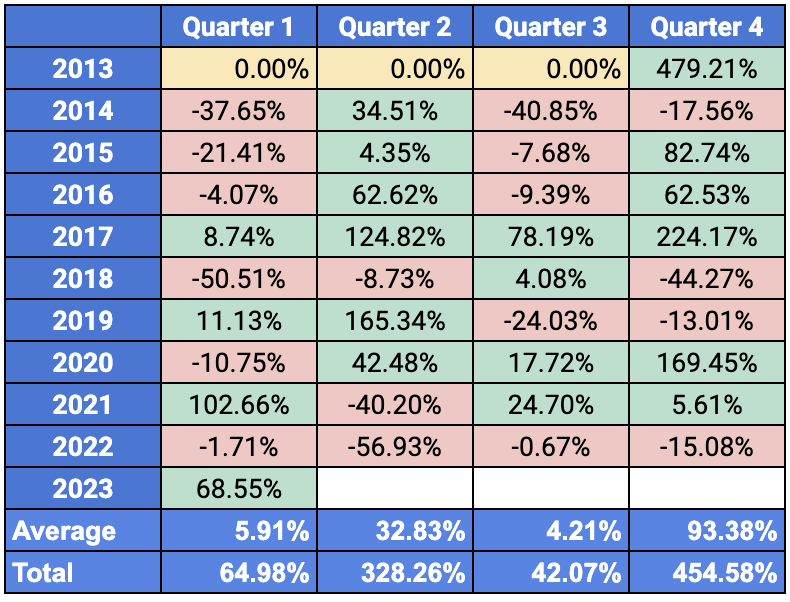
BTC quarterly returns
Key BTC levels on the monthly
Bitcoin price on the monthly timeframe shows that it has produced a higher high relative to August’s swing high at $25,205. This shift in market structure suggests that the ongoing uptrend is likely to continue, albeit after a minor retracement.
The Relative Strength Index (RSI) is currently below the 50-line, attempting to move higher. If the bullish momentum continues, allowing RSI to flip the midpoint, it could signal a continuation of the run-up.
Further supporting this optimistic outlook is the Awesome Oscillator (AO), which shows a steady decline in the bearish momentum as two consecutive months close with a spec of bullish momentum.
A flip of the RSI above the 50-line, if accompanied by AO moving above the zero line, would be a buy signal. The last time this similar structure formed was in 2019, after which Bitcoin price rallied 233% from $4,124 to $13,764 to setup a local top.
So if history repeats, the key levels to the upside include
- The accumulation level is roughly $24,700.
- Targets or take profit levels include $35,000 and $38,500
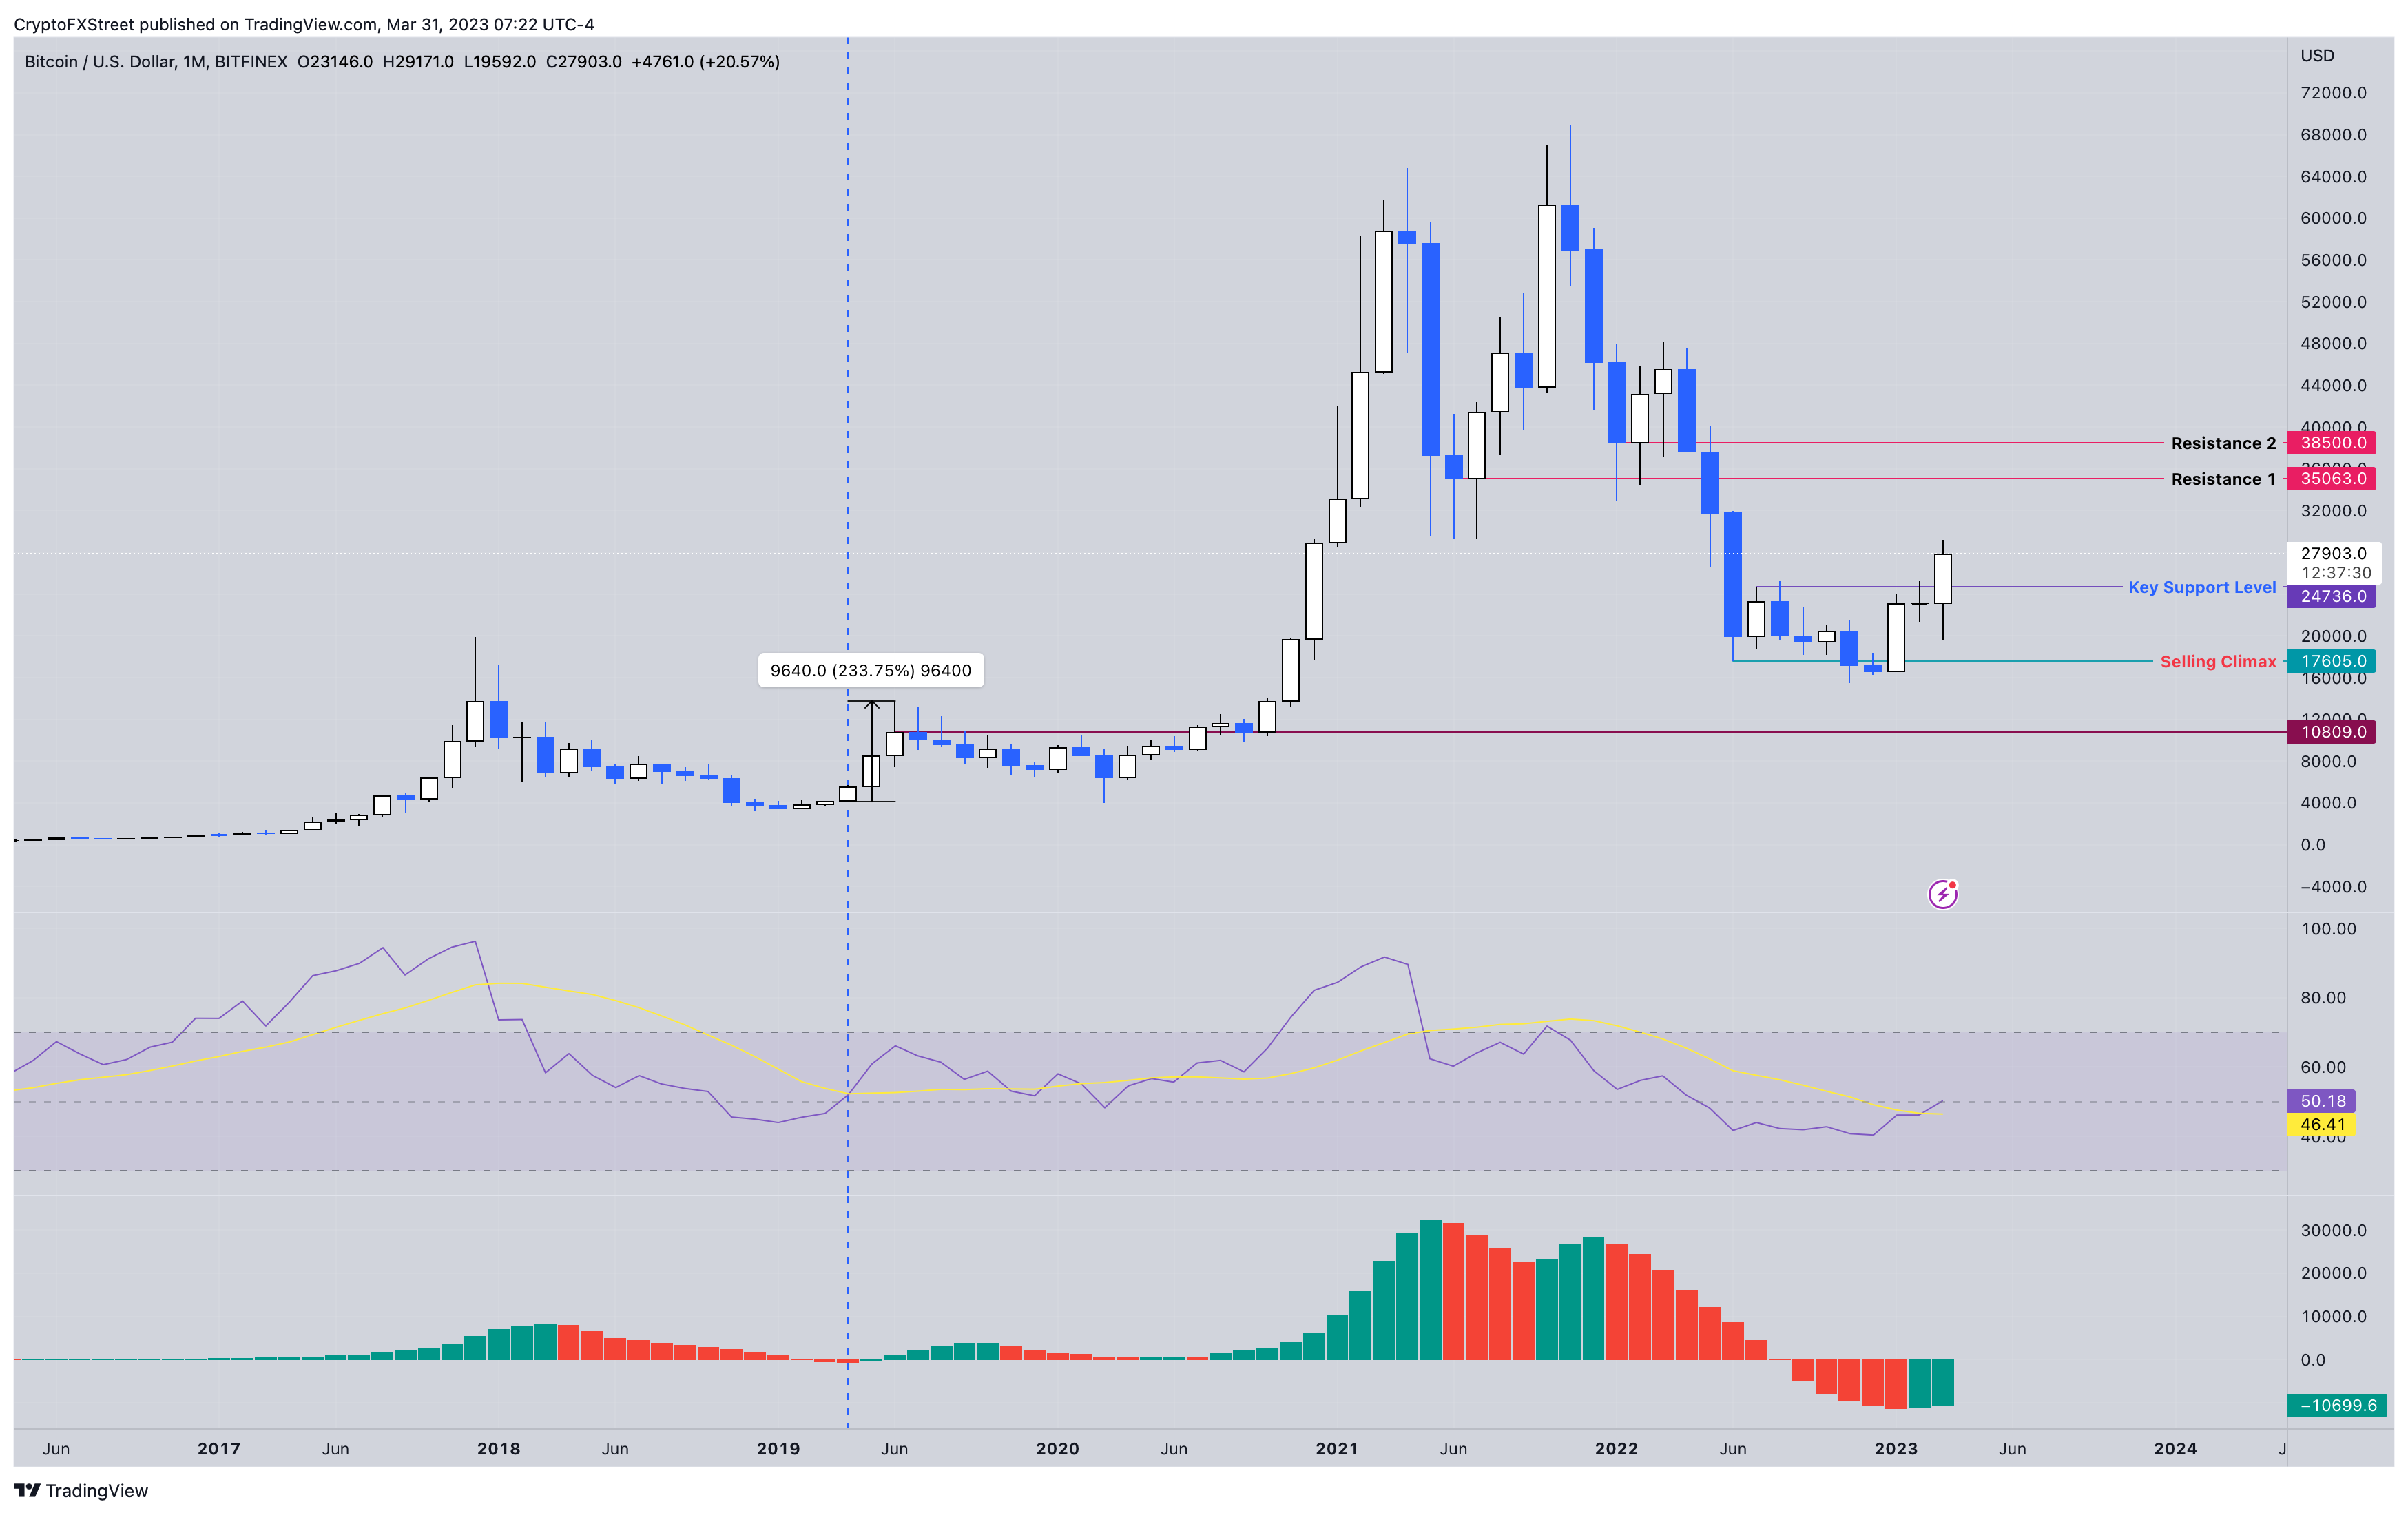
BTC/USD 1-month chart
Bitcoin price’s 3-day chart reveals how bears can takeover
The three-day chart for Bitcoin price shows a potential bearish breaker formation in early March. This setup occurs when the underlying asset produces a higher high but fails to sustain the uptrend. Instead, the correction slices below the down candlestick formed between the two higher highs.
This down candlestick is known as a bearish breaker, a decisive close below it at roughly $20,200 will trap the bulls and is likely to trigger a tremendous spike in selling pressure on the next retest from below.
As seen in the chart below, a bearish breaker was formed in August. A retest of this breaker after a breakdown below it triggered an unusual spike in selling pressure.
Coming back to the current outlook, BTC is still 25% away from retesting the upper limit of the bearish breaker. As mentioned above, only a decisive flip of the $20,200 level will confirm the existence of a bearish breaker.
A failure to close below the aforementioned level will indicate that the buyers are in control and could serve as a bouncing pad for the next leg-up.
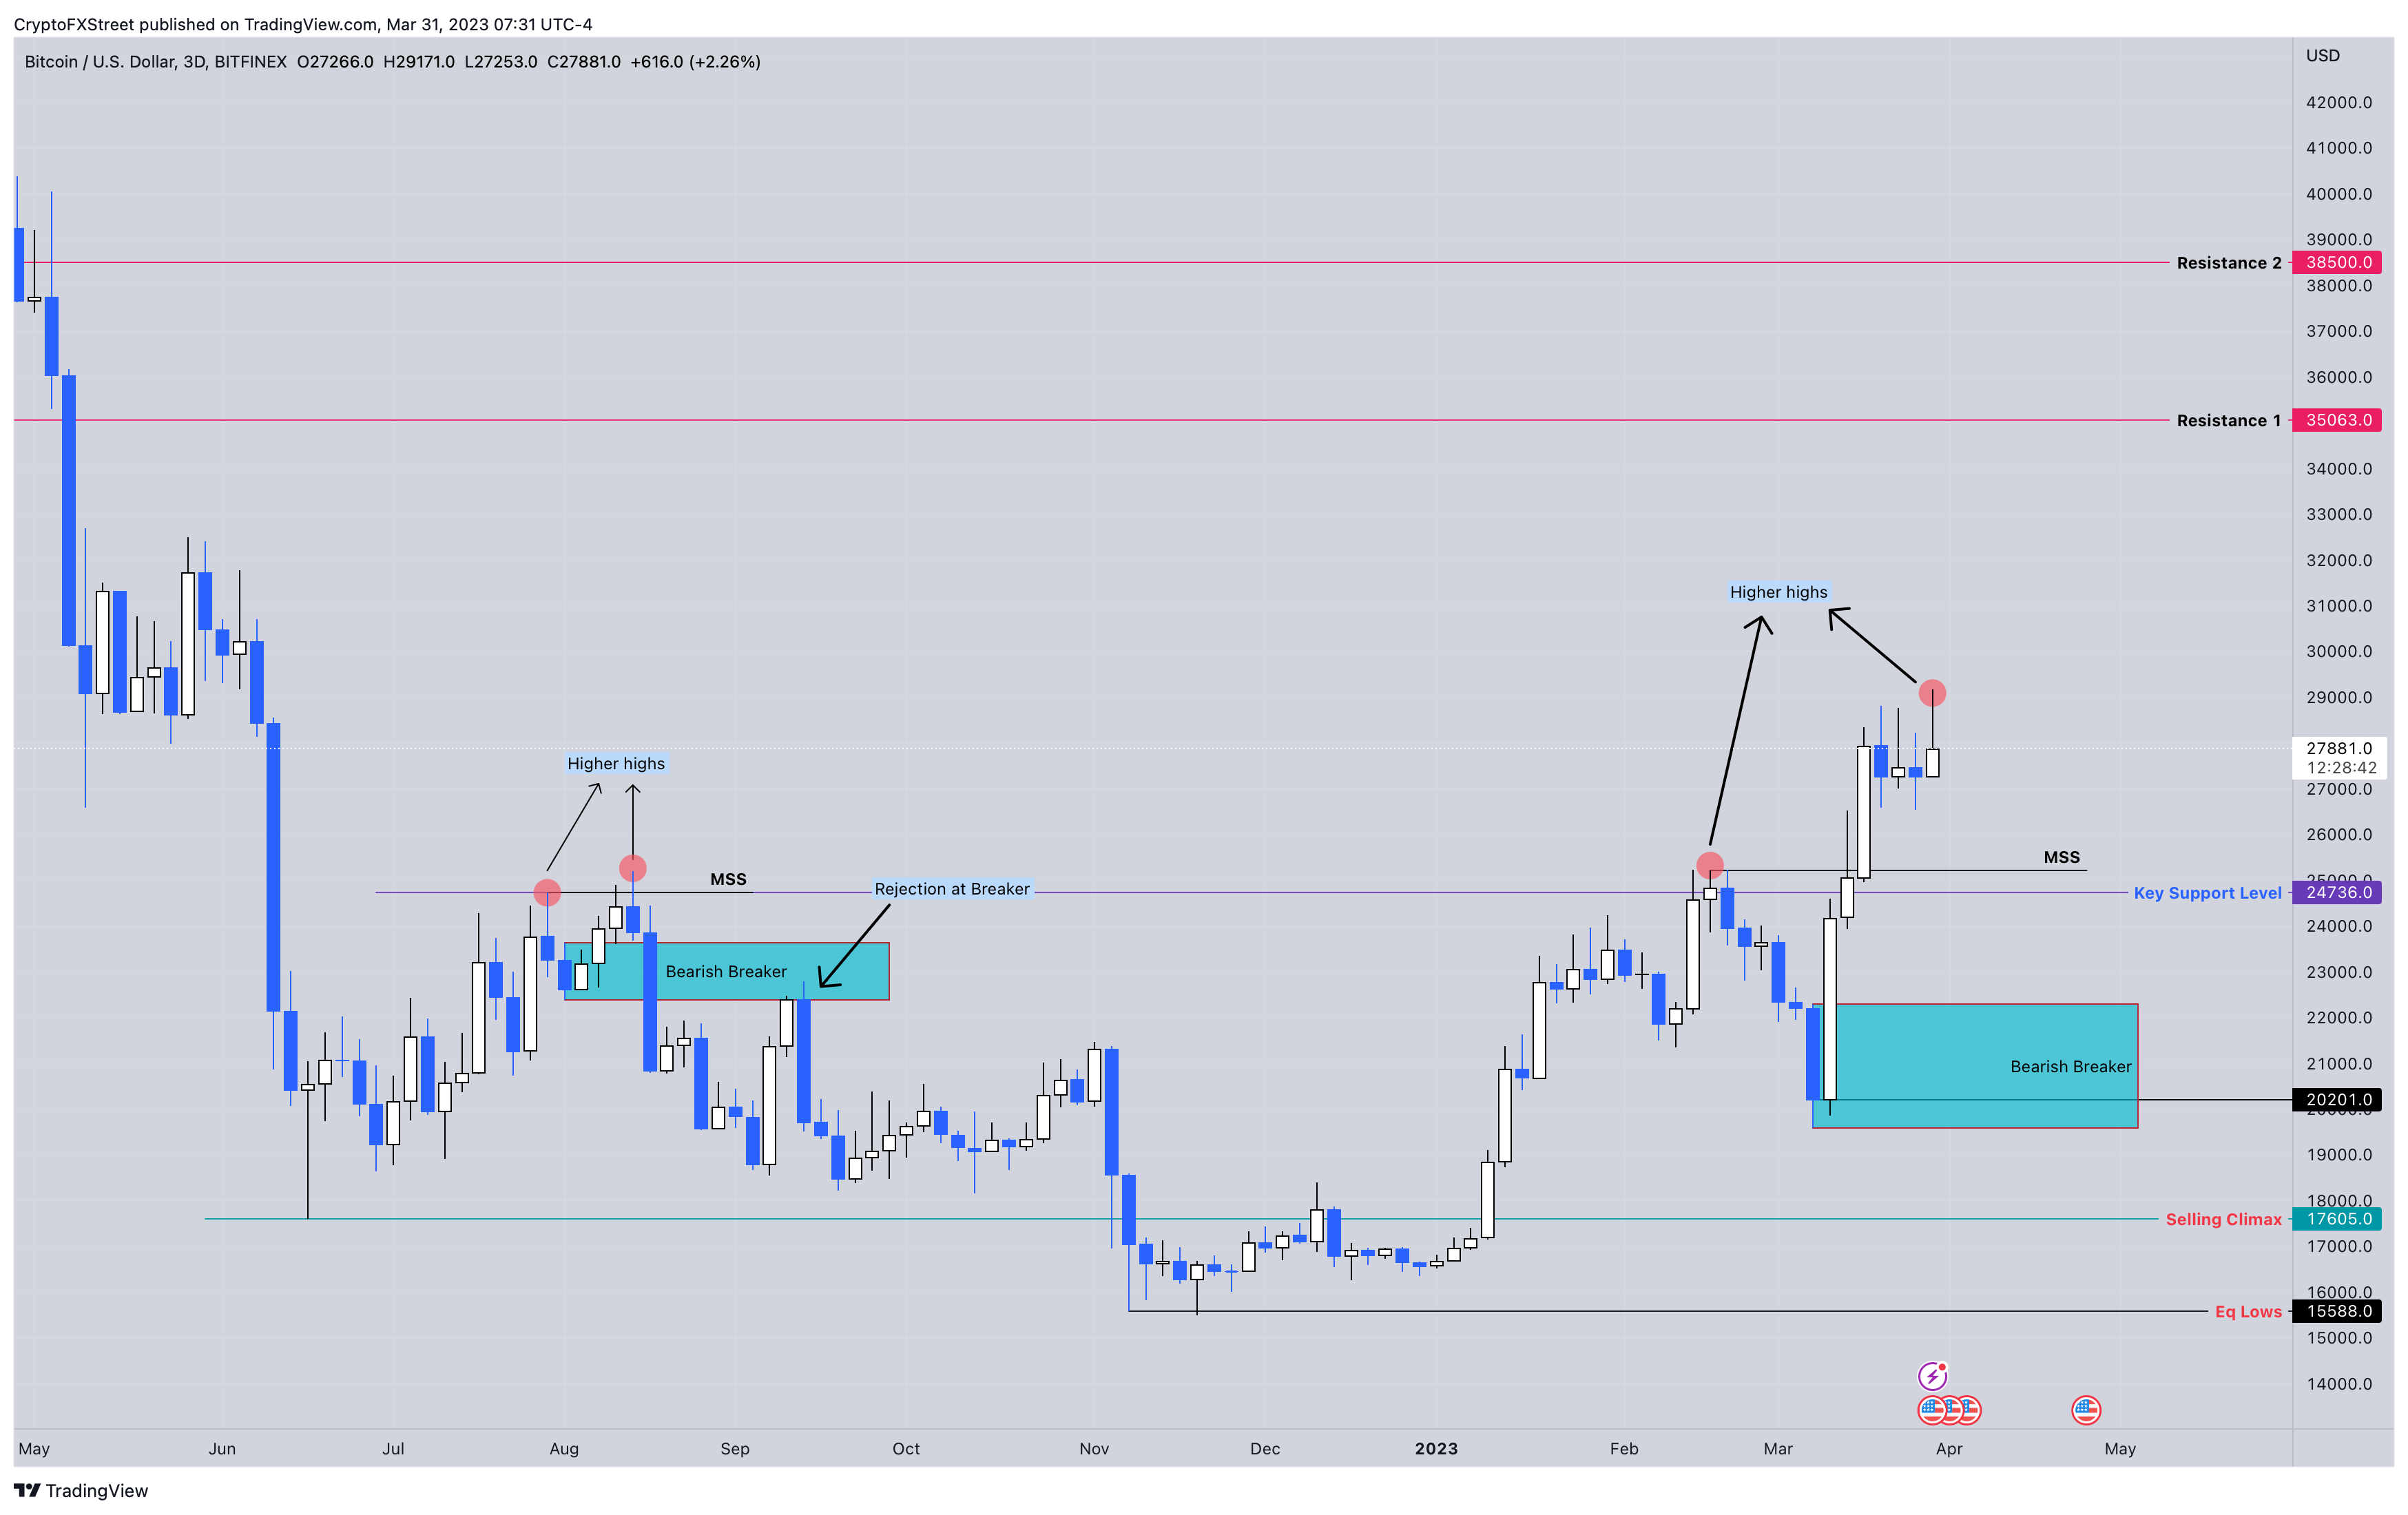
BTC/USD 3-day chart
BTC bears in luck on lower timeframe
The four-hour chart for Bitcoin price also confirms a bearish breaker formation. A retest of the breaker has triggered a rejection that could plummet BTC down to collect the sell-side liquidity at $26,547.
In some cases, the downtrend could exacerbate and tag $24,736, the key support level shown on the monthly chart.
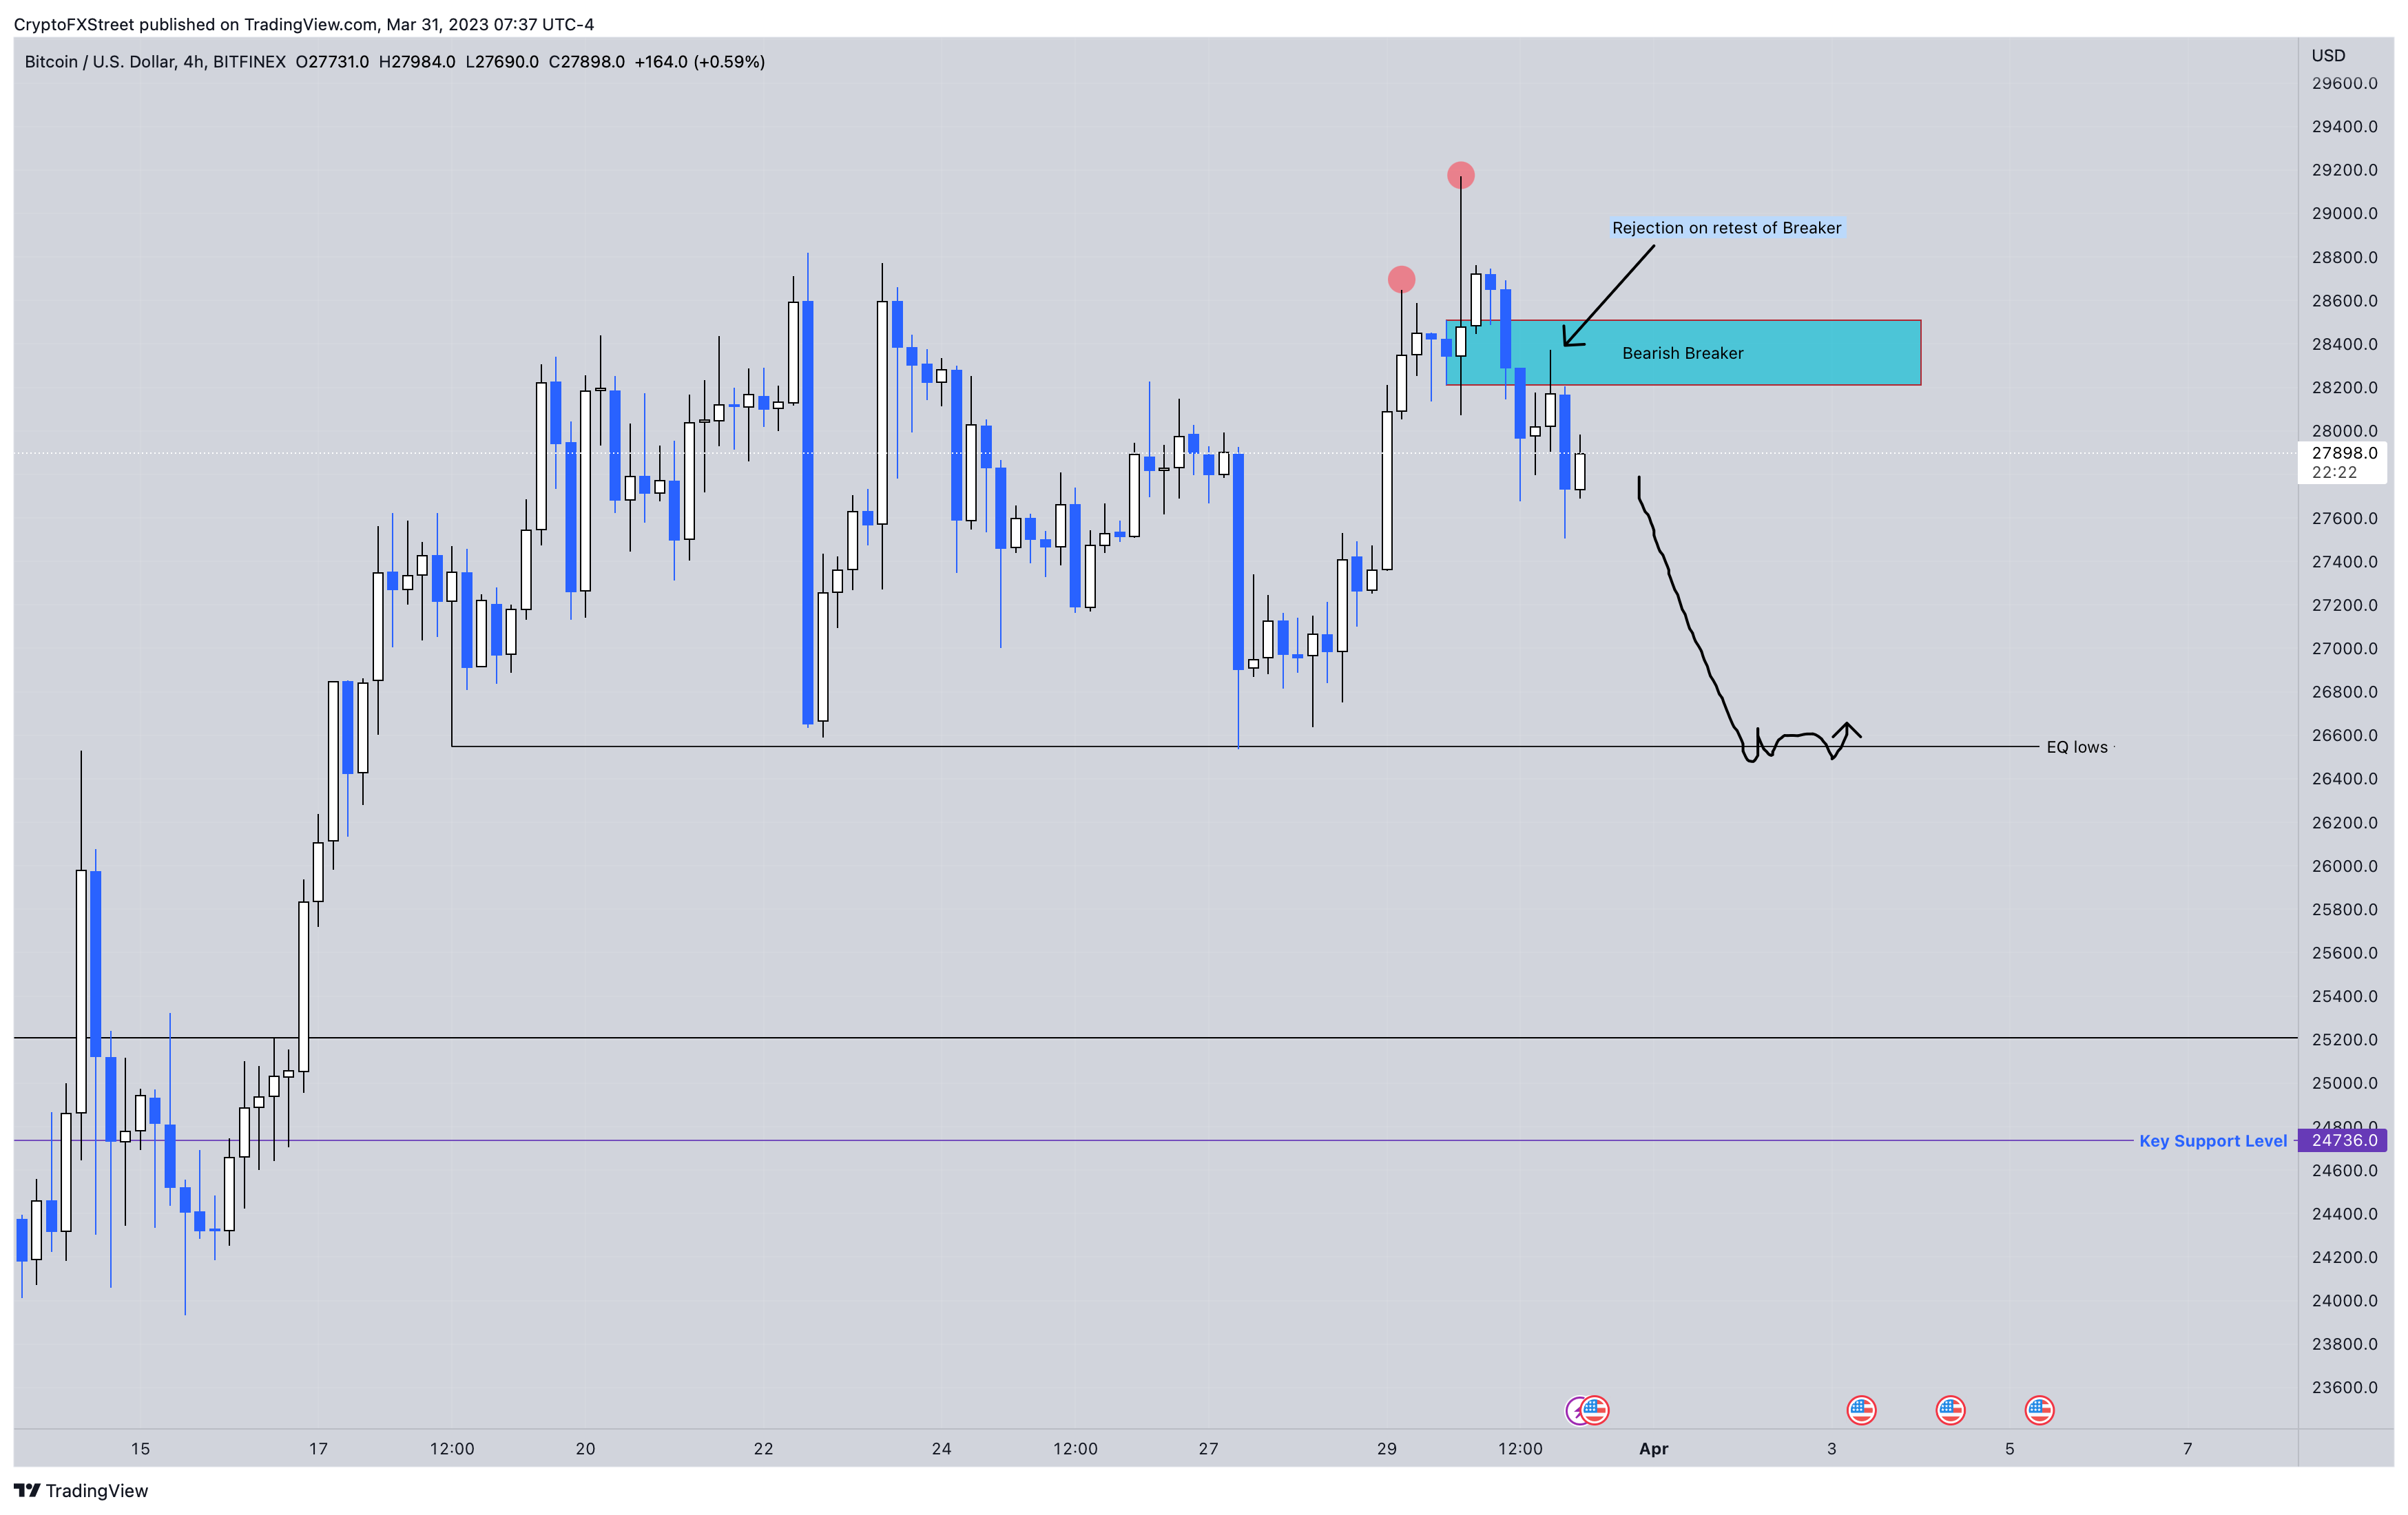
BTC/USD 4-hour chart
To reiterate, Bitcoin price shows a bullish outlook on the monthly and weekly timeframes, but there will be an opportunity for bears to profit off of a small-time pullback to key high timeframe (HTF) levels.
Invalidation of the long-term bullish outlook will occur if Bitcoin price slides below the $20,200 level and decisively flips it into a resistance level. Such a move could trigger the HTF bearish breaker to come alive. In such a case, investors should pay attention to the $17,605 support level, which is where the sellers climaxed after a 44% crash in June 2022.
A breakdown of this level could send BTC spiraling down to collect the liquidity resting below the $15,588 equal lows. In an extremely bearish case, Bitcoin price could tag the $10,809 support level. This move would denote an 84% drawdown from BTC’s all-time high of $68,958 and would potentially signal a bottom for the ongoing bear market.
Author

Akash Girimath
FXStreet
Akash Girimath is a Mechanical Engineer interested in the chaos of the financial markets. Trying to make sense of this convoluted yet fascinating space, he switched his engineering job to become a crypto reporter and analyst.


