Bitcoin stabilizes at support, faces resistance around 50k-53k

Bitcoin (BTC) buyers continued to defend support around $42,000 on Monday. The sell-off that began last week appears to be weakening as the cryptocurrency registers oversold signals. However, upside appears limited towards $50,000-$53,000 resistance.
The cryptocurrency was trading around $45,000 at the time of writing.
-
The relative strength index (RSI) on the four-hour chart is now oversold similar to the last week in April which preceded a price bounce.
-
The RSI is also oversold on the daily chart and is neutral on the weekly chart, which could signal a brief price recovery as sellers capitulate.
-
Initial resistance is around $50,000 and then at the 100-period moving average on the four-hour chart at $53,000.
-
Bitcoin continues to consolidate and is now at the bottom of a three-month range. The broader uptrend remains intact, albeit vulnerable to sharp swings and frequent drawdowns.
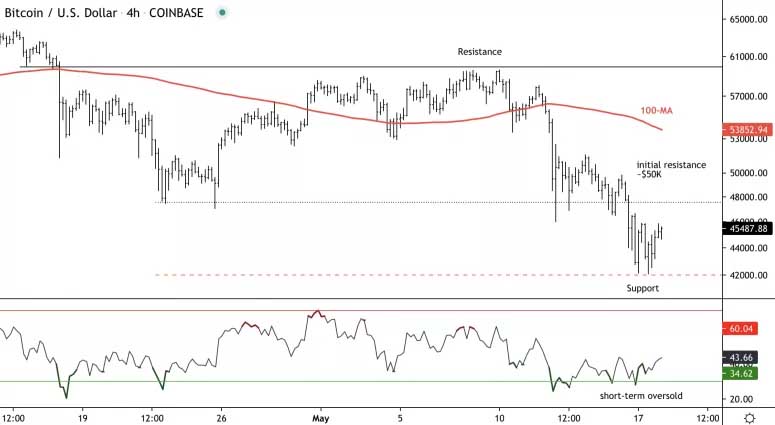
Four-hour bitcoin chart shows support and resistance levels with oversold RSI.
Source: TradingView
Author

CoinDesk Analysis Team
CoinDesk
CoinDesk is the media platform for the next generation of investors exploring how cryptocurrencies and digital assets are contributing to the evolution of the global financial system.


