- Bitcoin price hangs in the balance with losses likely to hit hard towards $11,500 support.
- Bitcoin's path of least resistance is downwards based on the negative signals oozing from technical indicators like the MACD.
Bitcoin price is staring into the abyss if the ongoing technical picture remains unchanged. On Monday, FXStreet reported the surge above $12,000 but Bitcoin bulls only managed to trade weekly highs at $12,084. A struggle to contain gains above $12,000 started but eventually, buyers lost the tug of war to the bears.
BTC/USD has continued with the downward action forcing the price below the short term support at $11,800. At the time of writing, Bitcoin has extended the bearish action close to $10,700. It is doddering at $10,745 amid a scuffle to hold above the 50 SMA in the 2-hour range.
Marginally below the 50 SMA is the triangle support. It is essential that Bitcoin holds above this level otherwise a breakdown looms toward the next support target at $11,500. All technical indicators are sending negative signals including the RSI and the MACD. The latter seems to be closing in on the midline and is extending the bearish divergence. Similarly, the RSI could fall under the average anytime and continued action towards 30 would signal more sellers to join the market, thereby pushing the bearish leg farther down.
BTC/USD 2-hour chart
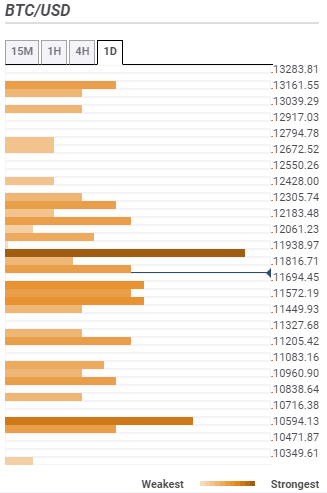
Bitcoin confluence resistance and support areas
Resistance one: $11,816 – Zone highlighted by the Bollinger Band 15-minutes lower curve, Bollinger Band 4-hour middle, the previous high 15-minutes and the SMA 200 15-minutes.
Resistance two: $11,938 – Home to the SMA ten 4-hour, the previous low 4-hour, the SMA 50 15-minutes and the Bollinger Band 15-minutes middle curve among others.
Resistance three: $12,061 – Highlighted by the Bollinger Band 15-minutes upper curve, the previous high 4-hour, the Fibo 23.6% one-day and the Bollinger band 1-hour upper curve.
Support one: $11,694 – Home to the SMA ten one-day, the pivot point one-day support one, the SMA 50 4-hour and SMA 200 1-hour.
Support two: $11,449 – Highlighted by the previous month high and the Bollinger Band 4-hour lower curve.
Support three: $11,205 – Hosts the Fibo 161.8% one-day and the Fibo 38.2% one-week.
Information on these pages contains forward-looking statements that involve risks and uncertainties. Markets and instruments profiled on this page are for informational purposes only and should not in any way come across as a recommendation to buy or sell in these assets. You should do your own thorough research before making any investment decisions. FXStreet does not in any way guarantee that this information is free from mistakes, errors, or material misstatements. It also does not guarantee that this information is of a timely nature. Investing in Open Markets involves a great deal of risk, including the loss of all or a portion of your investment, as well as emotional distress. All risks, losses and costs associated with investing, including total loss of principal, are your responsibility. The views and opinions expressed in this article are those of the authors and do not necessarily reflect the official policy or position of FXStreet nor its advertisers. The author will not be held responsible for information that is found at the end of links posted on this page.
If not otherwise explicitly mentioned in the body of the article, at the time of writing, the author has no position in any stock mentioned in this article and no business relationship with any company mentioned. The author has not received compensation for writing this article, other than from FXStreet.
FXStreet and the author do not provide personalized recommendations. The author makes no representations as to the accuracy, completeness, or suitability of this information. FXStreet and the author will not be liable for any errors, omissions or any losses, injuries or damages arising from this information and its display or use. Errors and omissions excepted.
The author and FXStreet are not registered investment advisors and nothing in this article is intended to be investment advice.
Recommended Content
Editors’ Picks
Charles Hoskinson and XRP community in loggerheads again, debate on Ethereum’s free pass resurfaces

Charles Hoskinson, the founder of Cardano, engaged in a debate with the XRP community over the rumors of ConsenSys founder, Joseph Lubin, bribing the US financial regulator.
Bitcoin Weekly Forecast: Analyzing potential $30k corrections ahead of BTC ETF approval

Bitcoin (BTC) price has slowed down its 2023 bull rally as it approaches the $37,000 level. After three weeks of consolidating around this level, BTC shows no directional bias whatsoever.
Solana likely to extend gains as DeFi airdrop season could boost user base

Solana ecosystem is set to experience a surge in activity from decentralized finance (DeFi) projects that offer users airdrops in the following months, according to a report from crypto market intelligence company Messari.
LUNC ranks among trending tokens alongside Dollar pegged stablecoin USTC, eyes recovery

Terra Classic USD and Terra Luna Classic tokens are trending among market participants after overnight price gains. USTC rallied to $0.078 local top after its 2022 collapse, garnering hope among traders.
Analyzing potential $30k corrections ahead of BTC ETF approval

Bitcoin has slowed down its 2023 bull rally as it approaches the $37,000 level. After three weeks of consolidating around this level, BTC shows no directional bias whatsoever. Some investors speculate this could be an upward-sloping accumulation that leads to a $40,000 rally.