Bitcoin Price Prediction: BTC finally out of the bears' hook, or is this a dead cat bounce?
- Bitcoin price eyes bullish move to $25,224, but first, it must conffirm a daily candlestick close above the 100-day EMA.
- Support between $20,156 and $20,763 adds credence to the bullish outlook in BTC price.
- Bitcoin price requires a continued increase in volume to keep the uptrend intact, otherwise retracment will likely occur.

Bitcoin price is in the green after breaking out to trade an intra-week high of $21,515 on some exchanges. The largest crypto's northbound move contradicts market expectations in light of the Federal Open Market Committee's (FOMC) decision to hike interest rates by 0.75% again. It is unclear if Bitcoin price will keep the uptrend intact, but investor optimism is on the roof for now.
Assessing the possibility of a short-term Bitcoin price rally to $25,224
Bitcoin price is generally in bullish hands, especially with the On-Balance-Volume (OBV) indicator in an upward-sloping trend. This position cements the bull's presence in the market. Moreover, CoinMarketCap reveals a 53.55% spike in volume traded over the last 24 hours.
The 100-day Exponential Moving Average (EMA) (in blue) is in place at $21,118 – protecting Bitcoin price's immediate downside. A daily candlestick close above this moving average is necessary to continue the northbound move first to $25,224 and possibly stretch the leg to $30,000.
Adding optimism to the bullish outlook in Bitcoin price is a vivid buy signal, as highlighted by the Moving Average Convergence Divergence (MACD) indicator. Traders who heed the call to long BTC as soon as the 12-day EMA (in blue) crossed above the 26-day EMA (in orange) saw their positions flip profitable instantly. Another cue was Bitcoin's move above a five-month trend line (in black).
Bitcoin price seems to have room for growth to the upside – and as such, investors who feel sidelined can hop on the wagon for a potentially profitable move to $25,224 and then to $30,000.
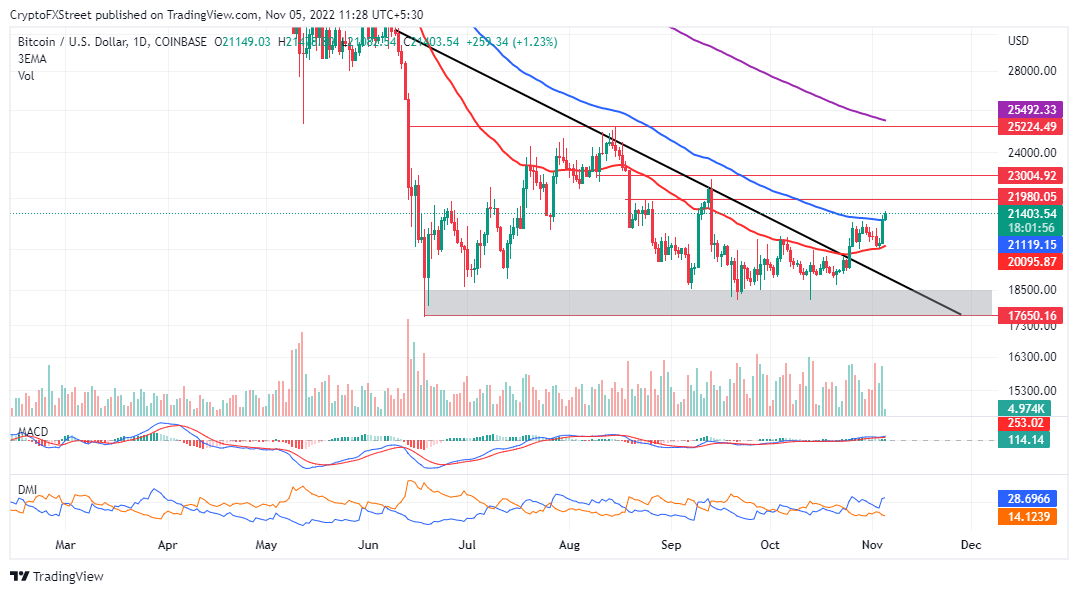
BTCUSD daily chart
A glance at the Directional Movement Index (DMI) exhibits a positive narrative for Bitcoin price. Buyers will generally stay at the helm of the trend as long as this index's -DI stays significantly above the +DI.
Relatively conservative traders can close their positions at $21,980 and $23,004, respectively. However, stubbornly bullish investors will likely ride the trend to $25,225, a hurdle marginally beneath the 200-day SMA, which currently holds the ground at $25,492.
On-chain data from IntoTheBlock shows Bitcoin price sitting above robust support. From the chart below, 1.65 million addresses previously purchased 1.09 million BTC between $20,156 and $20,763.
Holders within this range will likely continue buying BTC to keep the uptrend intact. On the other hand, they are unlikely to let bears wipe out the accrued gains as BTC moves to $25,224.
-638032280822716453.png)
Bitcoin IOMAP chart
Conversely, Bitcoin must hold above the 100-day EMA to keep retail traders hooked. Otherwise, a daily close below the same level could quickly turn short positions profitable with downside profit targets at the 50-day EMA (in red) and the primary support at $18,000.
Doctor Profit, an analyst on Twitter, told his followers that he expected Bitcoin price to break out after the FOMC decision. However, he warns that it might snap out of the trend as it moves in a bullish ascending triangle – depicting decreasing volume.
As expected, #Bitcoin breakout after FOMC. Its pretty common to see low volume before important events, big market makers trying to price in their next moves.
— Doctor Profit (@DrProfitCrypto) November 5, 2022
I can see a clear breakout right here, but caution. Have a look at the next Tweet. (1/3) https://t.co/qSjRq4ZV1y pic.twitter.com/egJHDWNoPu
In other words, more volume is necessary if Bitcoin price is to keep its bullish outlook intact throughout the weekend.
Author

John Isige
FXStreet
John Isige is a seasoned cryptocurrency journalist and markets analyst committed to delivering high-quality, actionable insights tailored to traders, investors, and crypto enthusiasts. He enjoys deep dives into emerging Web3 tren



![Zcash breaks above 2018 highs, eyes 1600–2500 [Video]](https://editorial.fxsstatic.com/images/i/crypto-coins-1.png)