- Bitcoin price is facing turbulence under the 200-day SMA as bears focus on June lows.
- Investors are unsure if they should buy or wait for lower prices, around $18,776.
- As Bitcoin price seeks an escape, all eyes shift to the Fed's annual economic symposium on Friday.
Bitcoin price is staggering between a rock and a hard place a couple of days after it abandoned the mission to close the gap to $28,000. The largest cryptocurrency bounced off support at $20,800 on Friday but has not been able to step above seller congestion around $21,818. On the other time, investors are jittery, citing overhanging fear of declines extending to June lows roughly at $18,776.
What to expect from Powell's speech on Friday
The United States Federal Reserve's annual economic symposium in Jackson Hole, Wyoming, will take place on Friday. Jerome Powell, the Fed chair, is expected to come out strong on the tightening cycle that has seen continuous interest in 2022. The crypto market's turbulence can highly be attributed to the Fed's tightening monetary policy.
"I would expect that Powell lays out quite clearly that the pace of future rate hikes may slow but that they have much further to climb and are likely to remain high for some time," Michael Kramer, the founder of Mott Capital Management, weighed in on the matter in a weekly markets update.
Sharing the same sentiment with Kramer is David Duong, the head of institutional research at Coinbase, who reckoned in a markets update that Powell will "emphasize that the tightening cycle isn't over yet."
The roughly 10% drop in Bitcoin price last week spooked investors, with more questions than answers arising – is the bottom price at $18,776 sufficient to turn the bear market around? And will Bitcoin hit $28,000 in the coming weeks?
Coinbase's David Duong reasons that "BTC will likely retest support at $20,830 and $19,230 over the coming few weeks." Two levels likely to determine Bitcoin price's next move are the 200-day Simple Moving Average (SMA) on the upside and the buyer congestion at $20,800. A break above this moving average would affirm the bulls' return in the market and push for $28,000.
On the downside, a daily close below $20,800 will trigger massive losses due to panic selling. In this case, support is projected at $18,776 – the June low.
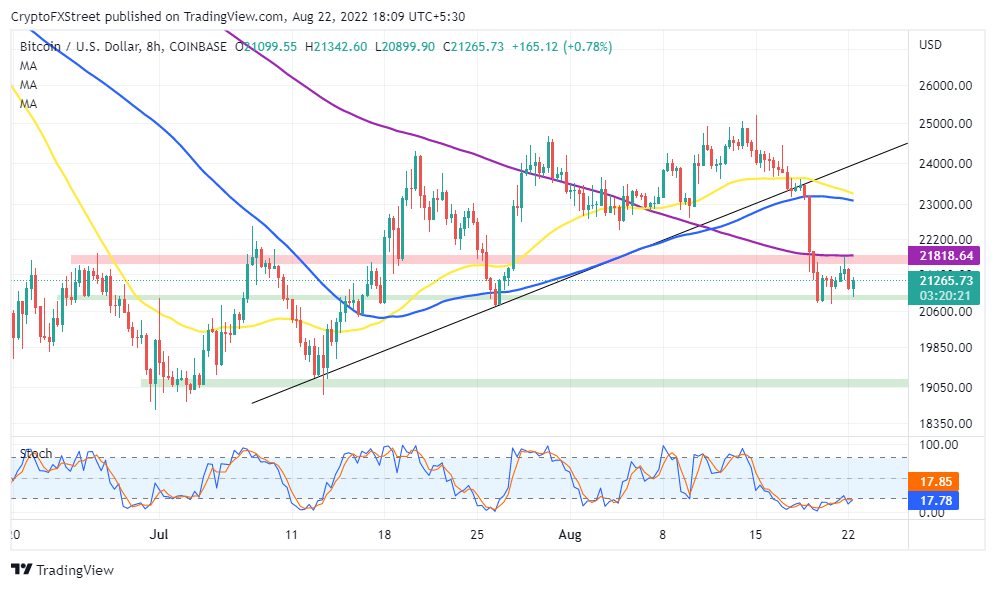
BTC/USD eight-hour chart
Despite the above pessimistic analysis, the same eight-hour chart paints a bullish picture for Bitcoin price. As highlighted by the Stochastic, recovery from the current oversold conditions could see BTC make headway above the 200-day SMA.
Information on these pages contains forward-looking statements that involve risks and uncertainties. Markets and instruments profiled on this page are for informational purposes only and should not in any way come across as a recommendation to buy or sell in these assets. You should do your own thorough research before making any investment decisions. FXStreet does not in any way guarantee that this information is free from mistakes, errors, or material misstatements. It also does not guarantee that this information is of a timely nature. Investing in Open Markets involves a great deal of risk, including the loss of all or a portion of your investment, as well as emotional distress. All risks, losses and costs associated with investing, including total loss of principal, are your responsibility. The views and opinions expressed in this article are those of the authors and do not necessarily reflect the official policy or position of FXStreet nor its advertisers. The author will not be held responsible for information that is found at the end of links posted on this page.
If not otherwise explicitly mentioned in the body of the article, at the time of writing, the author has no position in any stock mentioned in this article and no business relationship with any company mentioned. The author has not received compensation for writing this article, other than from FXStreet.
FXStreet and the author do not provide personalized recommendations. The author makes no representations as to the accuracy, completeness, or suitability of this information. FXStreet and the author will not be liable for any errors, omissions or any losses, injuries or damages arising from this information and its display or use. Errors and omissions excepted.
The author and FXStreet are not registered investment advisors and nothing in this article is intended to be investment advice.
Recommended Content
Editors’ Picks
Ripple's move above this key level could trigger nearly 50% rally for XRP
Ripple has overcome a critical resistance level and flipped into a support floor on the weekly time frame. This development happened while XRP tightly consolidated for roughly 250 days. Investors can expect XRP to kickstart a massive rally.
Optimism price outlook with nearly $90 million worth of OP tokens flooding markets on Friday
Optimism volatility has shrunk in the ours leading to the network’s cliff unlock. It joins the likes of dYdX and Sui, which have similar events on their calendars. As token unlocks are often considered bearish catalysts, investors should brace for a reaction after the event.
Top 3 Price Prediction Bitcoin, Ethereum, Ripple: Retail watches from the sidelines with a bias for shorts
Bitcoin could clear $73,777 peak as BTC bulls resurface. Ethereum might fall 10% before next leg up as ETH RSI teases with sell signal. XRP could lose $0.6000 threshold as Ripple bulls fail to show up.
Jito price could hit $6 as JTO coils up inside this bullish pattern
Jito price action shows a potential cup and handle formation. Based on theoretical measurement rules, a successful breakout could yield a 56% rally to $6.0. A breakdown of the $3.86 support level would create a lower low for JTO and invalidate the bullish thesis.
Bitcoin: BTC may have recovered, but is it out of the woods?
Bitcoin’s (BTC) upward momentum has shown a significant decline for the past two weeks or so. This development led to a bearish signal on the weekly and an uncertain outlook on the monthly.