Bitcoin price gets closer to the last big hurdle before $20,000

While the United States’ election is still undecided, Bitcoin (BTC) is experiencing a major rally, as BTC price nearly reached $16,000 today, the highest level since January 2018.
Other asset classes have also been doing well, such as Nasdaq, which saw gains of more than 7% in recent days. In the cryptocurrency markets, Ether (ETH) has started to climb as well, with ETH hitting $445.
The last weekly hurdle before a new all-time high is close
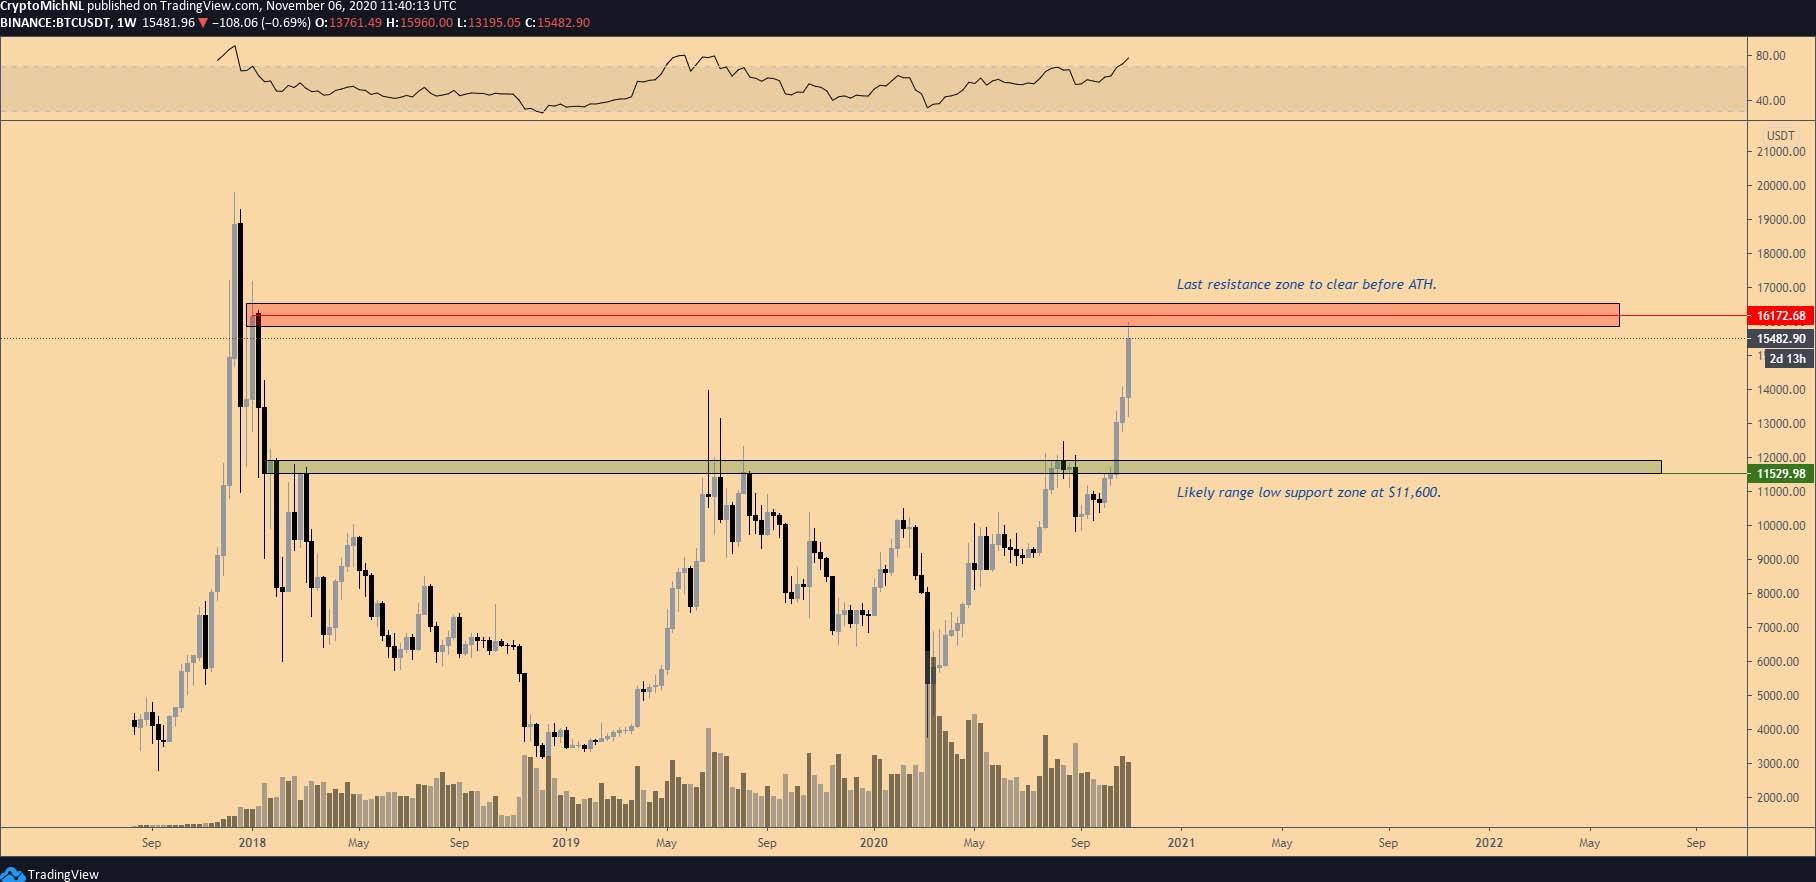
BTC/USDT 1-week chart. Source: TradingView
The weekly chart of Bitcoin is showing the final hurdle before the new all-time high can be reached, as it’s facing the resistance zone between $15,800 and 16,800.
The probability of a breakthrough in one go is not high, given that the price of Bitcoin has already surged by more than 50% in recent weeks.
Since the rally may now be overextended, as several indicators suggest, it’s unlikely to anticipate further continuation. In other words, traders will likely be taking some quick profits after such a huge rally in a short period of time.
Therefore, the most likely support zone based on the weekly chart is found at the $11,600–12,000 area. This zone has been a crucial resistance to a breakthrough in the previous years, as Bitcoin’s price has been constantly rejected in this area. A support/resistance flip in this area would be relatively healthy.
Fear and Greed reaching levels not seen before
The Fear and Greed Index is currently showing a value of 90, which is classified as extreme greed and warning traders that a correction should not come as a surprise.
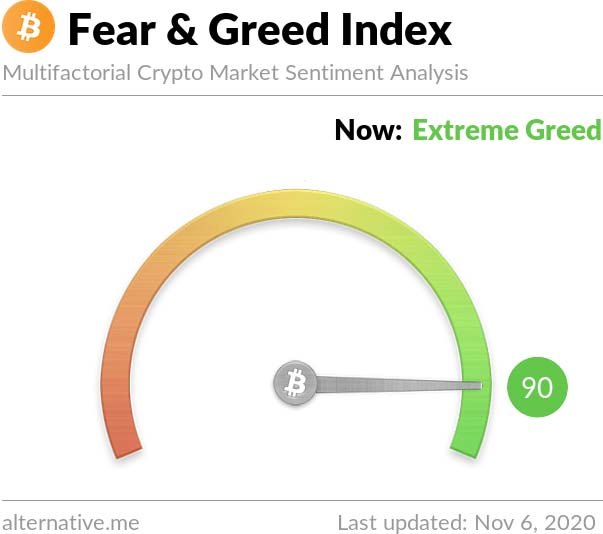
Crypto Fear and Greed historical index. Source: Alternative.me
The last time this sentiment level was reached was during the summer of 2019. This rally ran from $3,200 to $13,800 and ended in a correction of more than 50% in the following months.
Total market cap attempting a breakout continuation
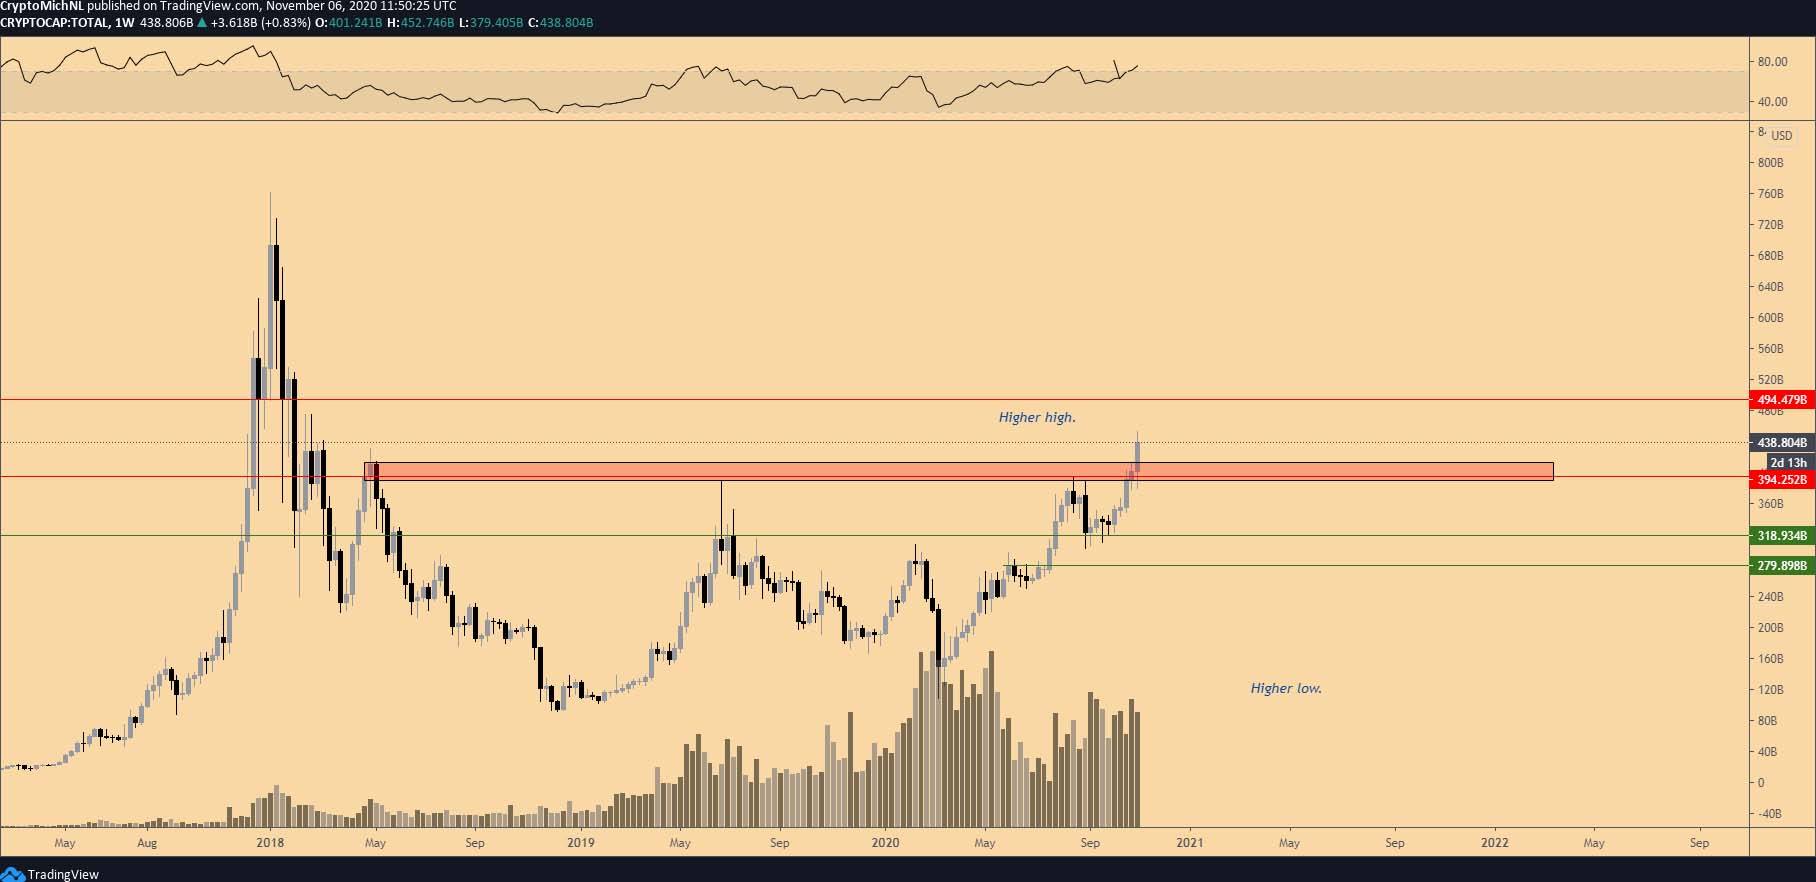
Total market capitalization cryptocurrency 1-week chart. Source: TradingView
The total cryptocurrency market capitalization is showing a clear breakout above the recent high of $390 billion.
This breakout looks likely to continue rallying toward $500 billion — the next resistance zone found on this chart. However, to sustain such a rally, the total market capitalization of cryptocurrencies has to hold above $390 billion, as that would potentially result in a bullish support/resistance flip for more upside.
Key levels to watch on the Bitcoin chart
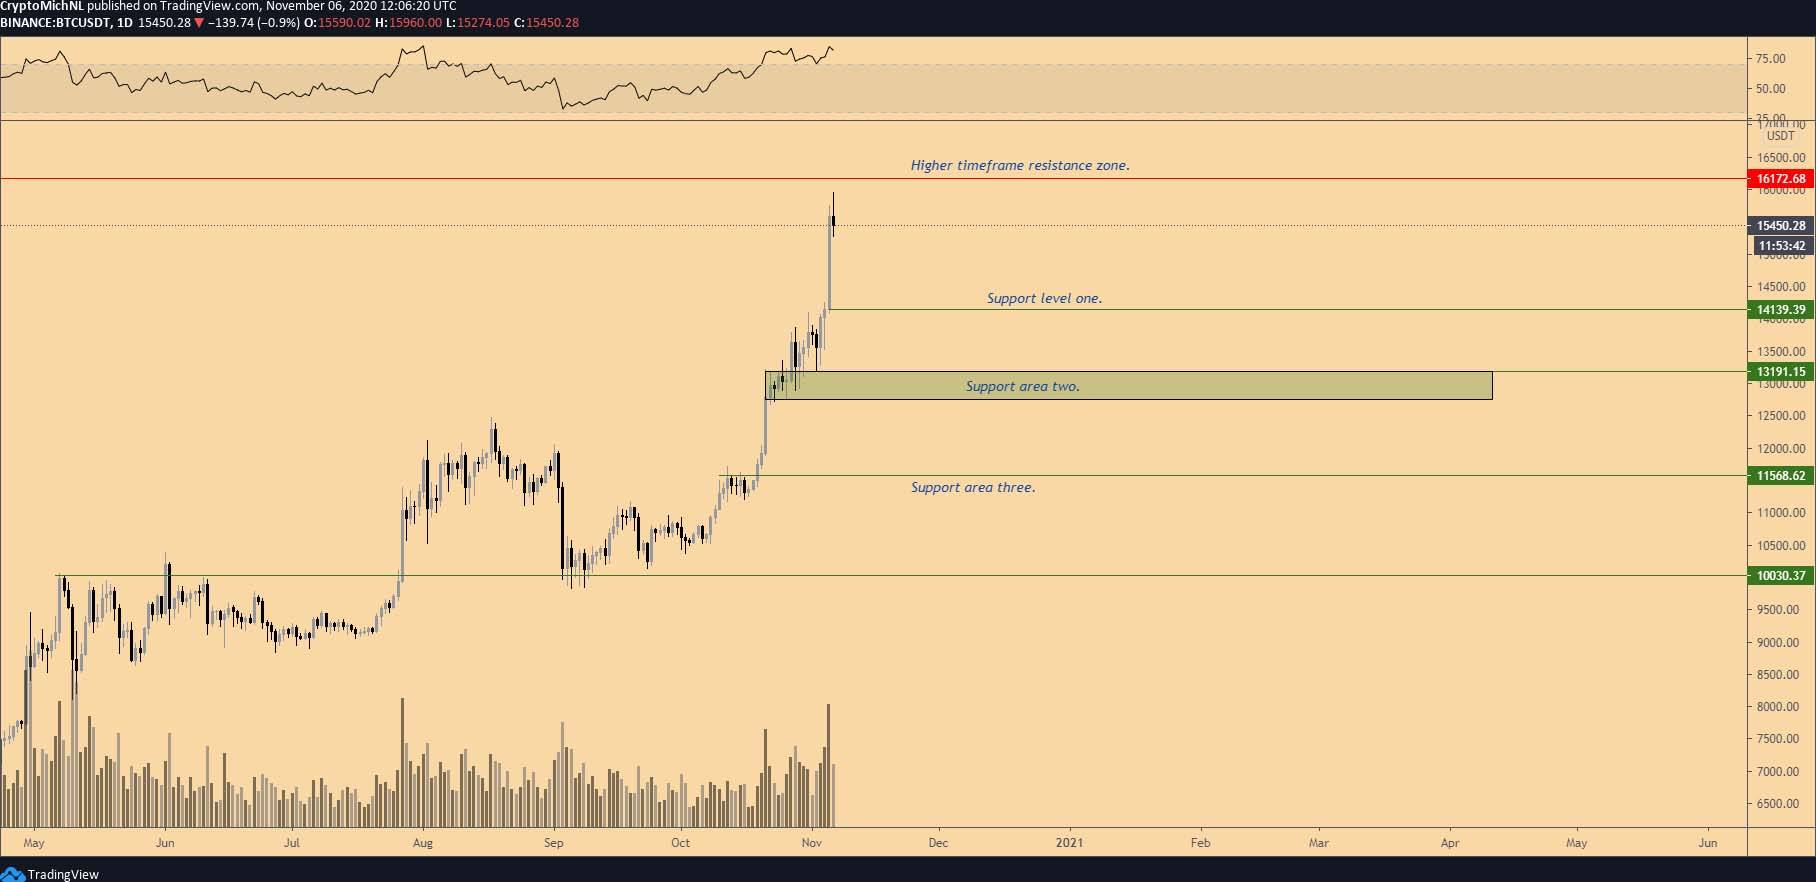
BTC/USDT 1-day chart. Source: TradingView
Bitcoin’s daily chart shows the BTC price approaching a higher timeframe resistance area at $16,000.
The support levels to watch are shown on the chart. The first support area is found between $14,000–$14,200, which traders should keep an eye on in the short term.
On the daily chart, the levels between $12,800–$13,100 and around $11,600 should be a trigger point for potential buy-the-dip entries in case of a correction (after failing to break above $16,000, for instance).
All in all, the sentiment is heavily bullish at this point, with the price at multi-year highs and only one major resistance level remaining at $16,000 before a new all-time high comes into play.
Author

Cointelegraph Team
Cointelegraph
We are privileged enough to work with the best and brightest in Bitcoin.


