Bitcoin Price Forecast: BTC faces strong resistance stack between $10,700-$10,800 – Confluence Detector
- BTC is currently sandwiched between the 50-12-hour and 200-12-hour SMA charts.
- The number of holders with >100,000 BTC has increased by 7 over the last three weeks.

At the time of writing the premier, cryptocurrency is hovering near the $10,600 mark. There is a lot of sluggishness in the market as neither the bulls nor the bears are looking to hold the price by the scruff of its neck. All this may soon change, though.
BTC/USD 12-hour chart
-637377204557710885.png)
The price is consolidating in a symmetrical triangle pattern and is currently sandwiched between the 50-12-hour SMA and 200-12-hour SMA. Strong resistance lies at the 50-12-hour SMA curve ($10,700) that has repeatedly rejected the price. So, where can we expect BTC to go next? For that, let’s consult the confluence detector.
BTC confluence detector
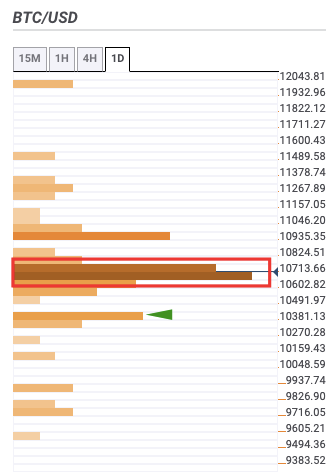
The confluence detector helps us identify strong resistance and support levels and predict BTC’s movement. As of now, there is a strong stack of resistance between $10,700-$10,800 (aka the 50-12-hour SMA curve), which is pushing the price down.
This repeated rejection may drop the price down to the $10,400 support level, which seems to be the only noticeable support level on the downside. If this level doesn’t hold firm, then you can expect the price to plummet below $10,000. In this case, one can expect BTC to fall to $9,700 before it encounters another healthy support.
Can the bulls break above the 50-12-hour SMA curve?
If the bulls do manage to gain enough momentum to break above the 50-12-hour SMA and the 100-12-hour SMA curves, they will be able to push BTC up to $11,300. While they may seem overly optimistic for now, Sanbase’s holder distribution chart shows us that the number of holders with >100,000 BTC has increased by 7 over the last three weeks.
BTC holder distribution
 [07.38.45, 08 Oct, 2020]-637377205323560794.png)
While this may not seem a significant number, keep in mind that each of these addresses holds millions of dollars worth of Bitcoin. The whales taking advantage of the stagnant price action to consolidate their positions bodes well for the overall market.
Verdict: As the flagship coin keeps making uninspired movements, the bears may soon run of patience and push the price below the $10,000 mark. On the other hand, the bulls will need to break above the 50-12-hour and 100-12-hour SMA curves to regain upward momentum.
Author

Rajarshi Mitra
Independent Analyst
Rajarshi entered the blockchain space in 2016. He is a blockchain researcher who has worked for Blockgeeks and has done research work for several ICOs. He gets regularly invited to give talks on the blockchain technology and cryptocurrencies.



