Bitcoin Price Prediction: BTC may break below $10,000 if bulls don’t wake up – Confluence Detector
- BTC has dropped below the 100-day SMA in the daily chart.
- The daily confluence detector shows an immediate resistance stack between $10,600-$10,700.

Bitcoin bears have remained in control of the market since yesterday, as the price dropped from $10,800 to $10,563 in the time period. The latest candlestick has opened below the 100-day SMA. As before, the price is still trending inside a symmetrical triangle pattern.
BTC/USD daily chart
-637376355201074437.png)
If the price has a bearish breakout from the triangle, the price will drop down to the $9,974.50, as defined by the TD sequential indicator. In the process, the price will finally break below the $10,000-mark. If the sellers break below this support level, it will be pretty catastrophic as the next viable support level is at the 200-day SMA ($9,520). The MACD shows that the market momentum is on the verge of reversing from bullish to bearish, which adds further credence to our pessimistic outlook.
On the flip side, if the buyers manage to have a positive breakout from the triangle, they will take the price up to the $11,950 resistance line, as defined by the TD sequential indicator. However, to make this upward price movement, the daily confluence detector tells us that BTC will first need to overcome a robust resistance stack between $10,600 and $10,700.
BTC daily confluence detector
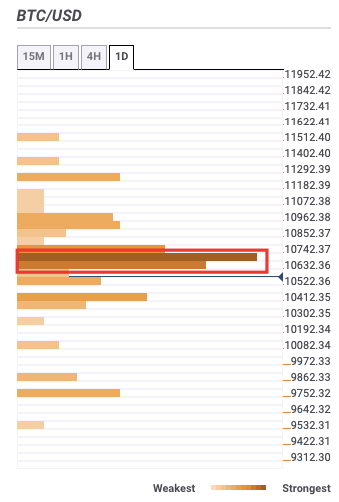
The daily confluence detector is a useful tool that helps us locate strong resistance and support levels. As shown in the chart above, BTC bulls need to overcome the $10,600-$10,700 resistance stack to initiate price recovery.
BTC/USD 4-hour chart
-637376355961875324.png)
The 4-hour BTC/USD chart shows us that the current situation definitely favors the bears. The parabolic SAR has reversed from bullish to bearish. The price is currently sitting on top of the 200-4-hour-SMA curve. If the sellers manage to break below that, the next healthy support lies at $10,535. The only way the bulls can salvage this situation is to push the price up to the $10,800-level and force the parabolic SAR to reverse from bearish to bullish.
Bitcoin on-chain metrics
Let’s look at some charts from Santiment to gain a better understanding of the Bitcoin's overall network health.
Bitcoin 30-day MVRV
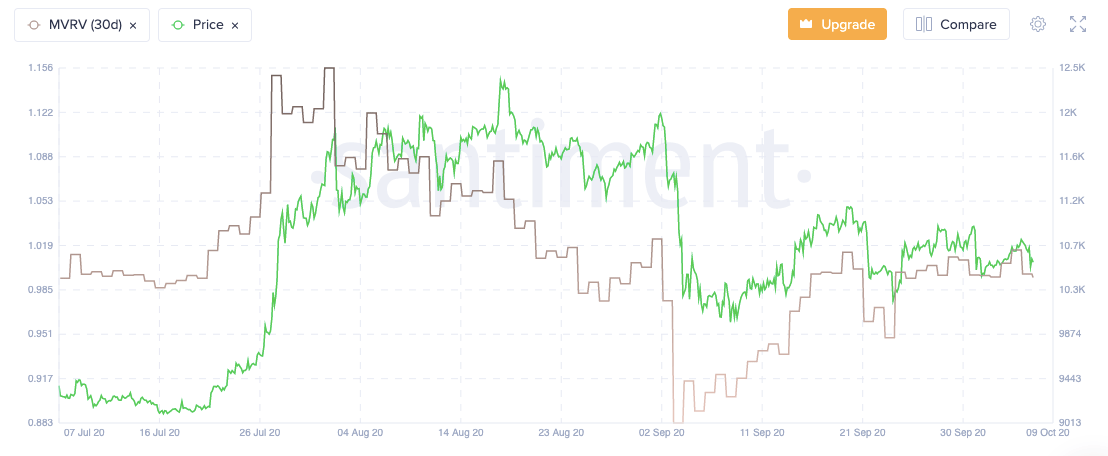
The 30-day Market Value To Realized Value (MVRV) is a metric that helps us see the average profit or loss of BTC holders in the last 30 days. This metric is based on the price when each token last moved. So, if MVRV is 1.5, then that means the holders have currently made 1.5X their investment. As of now, the MVRV is trending around 1, which shows that the holders have just about broken even on their initial investment. So, despite the bearish price action, the overall sentiment seems to be neutral.
Bitcoin Mean Coin Age
 [07.53.35, 07 Oct, 2020]-637376356854079177.png)
The mean coin age (MCA) visualizes the average amount of days that all BTC have stayed in their current addresses. A rising trend in this chart is indicative of a network-wide accumulation phase. As you can see for Bitcoin, the MACD has risen steadily over the last three months. This shows that the long-term holders are strengthening their positions irrespective of the price action.
Bitcoin Exchange Inflow
 [07.53.45, 07 Oct, 2020]-637376358210222979.png)
The final metric that we will look into is the exchange in-flow. This chart visualizes the amount of BTC moving daily to exchange wallets, not counting exchange-to-exchange transactions. A spike in the metric signifies short-term sell pressure. The thing to note about the latest bearish price action is that it doesn’t coincide with a large spike in the exchange inflow. This tells us that there is no intense selling pressure dictating this bearish price action, which is a positive sign.
Author

Rajarshi Mitra
Independent Analyst
Rajarshi entered the blockchain space in 2016. He is a blockchain researcher who has worked for Blockgeeks and has done research work for several ICOs. He gets regularly invited to give talks on the blockchain technology and cryptocurrencies.


