Top 3 Price Prediction Bitcoin, Ethereum and Ripple: Uncertainty brews as Bitcoin eyes $10,000
- Bitcoin price could stay in consolidation before volatility returns, but declines to $10,000 are still possible.
- Ethereum is retreating towards $320 and $300 levels due to the lack of robust support.
- Ripple bulls have started to regain control after losses hit pause at $0.24.

It is a time of uncertainty in the cryptocurrency market. Price actions have remained sluggish across the board. On the downside, selling activities appear to be gaining momentum with Bitcoin having lost a subtle 0.12% on the day. Ethereum is also in the red after losing 0.8% of its value, while Ripple is trading 0.56% lower daily.
Regarding the top 50 cryptocurrencies, the biggest losers include Compound, down 12% in the last 24 hours, UMA down 12%, OMG Network down 13%, Yearn.finance down 16%, and Aave down 18%. The only bull among the sloths of bears is EOS, which broke out massively as reported on Tuesday.
Bitcoin on the verge of a breakdown to $10,000
The flagship cryptocurrency is doddering at $11,590 at the time of writing. Earlier in the week, bulls regained control, pulling the price to $10,800. However, bears swung into action, overwhelming the buying pressure.
According to the Relative Strength Index (RSI), BTC is weighed down by selling pressure. Moreover, a symmetrical triangle could imminently break down, paving the way for losses towards $10,000. It is essential to keep in mind that support at $10,200 will absorb some of the selling pressure, hence cushion the bellwether cryptocurrency from plunging drastically. For now, the path of least resistance is downwards, especially with the 50 Simple Moving Average limiting price action at $10,684 in the 4-hour timeframe.
BTC/USD 4-hour chart
 (42)-637376484924147787.png)
IntoTheBlock’s IOMAP model illustrates the largest resistance areas between $10,602 and $10,911. Here, 2.1 million addresses previously bought 1.4 million BTC. If this seller congestion zone flips into support, the price can rally above $11,500.
Bitcoin IOMAP chart
-637376488473327095.png)
On the downside, immense support is highlighted by the model. In other words, the pioneer cryptocurrency could continue with the sideways price action until volatility returns either for a breakout or a breakdown. Meanwhile, the most robust support sits between $9,327 and $9,655. Here, roughly 1.3 million addresses previously purchased 832,000 BTC.
Ethereum renews the bearish narrative to $320
Ethereum has since September 23, been holding within an ascending parallel channel. Recovery towards $400 fizzled out slightly above $360 last week. On the downside, the losses that followed embraced support at $335 over the weekend, allowing the smart contract token to rally, gaining ground above $350. Unfortunately, selling pressure in the market stopped the uptrend at the 50 SMA and 100 SMA. Ether dipped below the ascending channel, confirming a bear flag.
ETH/USD 4-hour chart
 - 2020-10-07T080922.502-637376487228736414.png)
At the time of writing, ETH/USD is trading at $337 amid a developing bearish momentum. The selling pressure is illustrated by the Moving Average Convergence Divergence (MACD) as it dips into the negative territory. The bearish divergence beneath the MACD paints a bearish picture for Ethereum as well.
IntoTheBlock IOMAP model reveals the most vigorous resistance from $349 - $359. Previously, 886,000 addresses bought approximately 14 million Ether that range. The seller congestion in this area has the power to absorb most of the buying pressure, delaying the possibility of a breakout above $360.
Ethereum IOMAP chart
-637376486325044346.png)
On the downside, the absence of a substantial support area shows that Ethereum is in grave danger of spiraling to $300. Besides the multiple subtle support zones, the most profound one lies between $298 and $309. Previously, roughly 879,000 addresses bought nearly 2 million ETH.
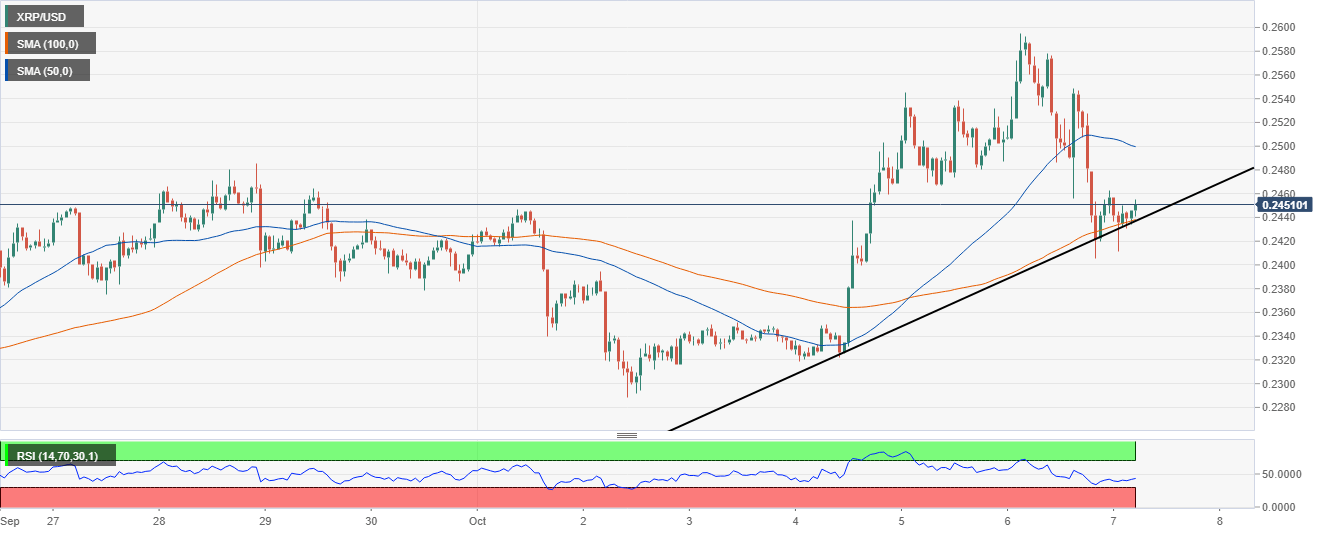
Ripple holds above $0.24 as bulls swing back
Ripple made a remarkable recovery from the lows traded in the first week of October at $0.228. Resistance at $0.25 delayed the rally, but XRP finally shot above it, closing in on $0.26. Gains towards $0.3 become unattainable owing to the uncertainty and selling pressure across the crypto market.
XRP/USD retreated to $0.24 before reversing the trend to the current price of $0.2450. The 100 SMA in holding the price in position. The RSI is in the middle of recovery to the midline. Action heading to the oversold area will result in more buying pressure likely to pull XRP above the 50 SMA in the hourly timeframe.
XRP/USD 1-hour chart
According to Santiment, a renowned on-chain data platform, the exchange outflow of XRP tokens has gone up significantly. The exchange outflow metric measures the volume of tokens moving out of exchanges and into non-exchange wallets. It is common for such large movements to precede declines in the price of an asset. The chart illustrates an outflow of 26 million XRP on October 6 just before the price dipped to $0.24. If the outflow continues to surge, XRP could drop further, but if it goes down, the price could stabilize, continuing the uptrend.
Ripple exchange outflow
 exchange outflow-637376494117235309.png)
Daily takeaway
Bitcoin holds above $10,500, following the rejection at $10,800. The symmetrical triangle pattern highlights the possibility of a breakdown to $10,000, if not $10,200. IntoTheBlock (ITB) also shows the likelihood of consolidation taking precedence in the near term.
Ethereum’s path of least resistance remains downwards, especially with the price trading under the bear flag. ITB illustrates the absence of an important support area, hence the possible breakdown. A tough resistance will also delay price action above $360.
The fourth-largest cryptocurrency is heading north at the time of writing. The 100 SMA in the hourly range is holding the bullish case in place. More action is expected to $0.25 now that the exchange outflow is reducing.
Author

John Isige
FXStreet
John Isige is a seasoned cryptocurrency journalist and markets analyst committed to delivering high-quality, actionable insights tailored to traders, investors, and crypto enthusiasts. He enjoys deep dives into emerging Web3 tren


