Bitcoin Price Analysis: BTC/USD recovery picks up the pace above $8,600
- Bitcoin price bullish recovery stalls under $8,600 as sideways trading kicks in above $8,500.
- Technical analysis supported by various technical indicators suggests that sideways trading and consolidation could take center stage.

Bitcoin price is having a positive start to the week’s trading. The Asian session on Monday is characterized by increased buying entries amid the building bullish momentum. BTC/USD is up a subtle 1% while trading at $8,614. Bitcoin price has advanced upwards from an opening price of $8,525.75 although it also recorded an intraday low of $8,485.52.
The daily chart shows Bitcoin trading under the moving averages where the 200-day SMA is limiting upward movements at $8,760.46 and the 50-day SMA holding the ground at $9,276. The 61.8% Fibonacci level of the last swing high at $10,537 to a swing low of $6,438.93 will also cap gains towards $9,000.
Technically examining the BTC/USD daily chart, while the digital asset downside is strongly protected, upward movements remain to be limited. Therefore, formidable direction the price will is likely sideways. The RSI, for instance, is at 37.93 with gradual movement towards 50 (the average zone).
BTC/USD 1-hour chart
-637187135247062814.png)
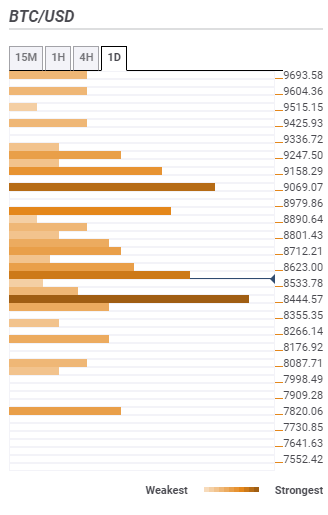
Bitcoin price confluence levels
According to confluence levels, Bitcoin first support is seen at $8,533 highlighted by the Bollinger Band 15-minutes lower curve and the previous low 1-hour. The second support also major support is $8,444.57 where the previous low 4-hour, Bollinger Band 1-hour lower and the Bollinger Band 4-hour lower curve converge. Other minor support areas include $8,355, $8,266 and $8,087.
On the upside, initial resistance is holding the ground at $8,623 as shown by the SMA 100 15-mins, previous high 1-hour and the Bollinger Band 1-hour middle. The next hurdle likely to give the bulls a hard time in the journey to $9,000 is $8,979, $9,069 and $9,158.
Author

John Isige
FXStreet
John Isige is a seasoned cryptocurrency journalist and markets analyst committed to delivering high-quality, actionable insights tailored to traders, investors, and crypto enthusiasts. He enjoys deep dives into emerging Web3 tren


