Bitcoin Price Analysis: BTC breaks above the downward wedge formation
- Bitcoin's recovery boosted by the launch of options contracts on CME.
- BTC/USD may continue the recovery if a move above $8,500 is sustained.

BTC/USD is changing hands at $8,500, having gained over 4.5% on a day-to-day basis and over 5% since the beginning of Tuesday. The first digital currency has been moving within a strong bullish trend during early Asian hours amid strong demand on Bitcoin options launched on CME.
Options on Bitcoin futures launched on CME
CME Group launched much-anticipated Bitcoin options on futures contracts and traded 54 contracts during the first trading session. The industry is enthusiastic about the new instrument as it expands investors' options in terms of risk management. According to the CME announcement, the decision to introduce Bitcoin option contracts was based on growing investor demand.
Notably, CME options saw better demand than the similar contracts launched on a rival exchange known as Bakkt on December 9.
“The launch of listed options on futures is a significant step in the direction of increasing exposure to Bitcoin. Options are only launched and tradable on a liquid underlying and the trend in BTC futures on the CME is increasing volume and open interest,” Mike McGlone, an analyst with Bloomberg Intelligence, commented.
However, the expert also noted that the results of the first weeks and months might be more relevant for defining a trend.
BTC/USD: technical picture
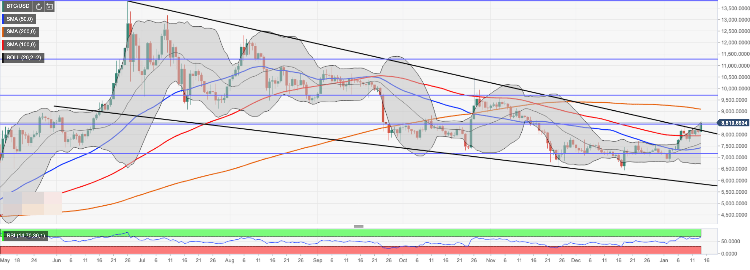
From the technical point of view, BTC/USD broke the upper boundary of the descending wedge and came close to 50% Fibo retracement for the upside move from December 2018 low to July 2019 high. Once this barrier is sustainably broken the upside momentum will gain traction with the next focus on psychological $9,000 reinforced by SMA200 daily.
On the downside, if a move above $8,500 cannot be sustained, the coin may start a correction and return to $8,000 handle. Considering a combination of strong technical levels clustered around this barrier (including SMA100 daily), the downside momentum is likely to slow down here. If it is broken, the sell-off may be extended to aw low as $7,400 (SMA50 daily).
BTC/USD daily chart
Author

Tanya Abrosimova
Independent Analyst


