Bitcoin price all but confirms a bearish breakout amid opposing on-chain metrics
- Bitcoin price is at the last leg of a distribution phase, suggesting an emerging downtrend.
- The breakout of a falling wedge during this leg adds credence to the downswing narrative.
- A daily candlestick close above $24,989 will invalidate the bearish outlook.

Bitcoin price shows a confluence of bearish developments that suggests an incoming downtrend. This development could halt the bullish outlook seen in Ethereum and other related altcoins.
Bitcoin price is ready for a dip
Bitcoin price is in a classic Wyckoff Distribution Phase, where the asset losses buying pressure and momentum as investors start to unwind their holdings to book profits. Typically, there are identifiers and five phases to determine a top formation.
- After the primary supply (PSY) is formed, the buying pressure climaxes (BC), which leads to a pullback or an automatic reaction (AR).
- After this, the price usually attempts and fails to produce a higher high, termed the secondary test (ST).
- The weakness becomes apparent as the asset produces a lower low relative to the AR and is referred to as a sign of weakness (SOW).
- This development is followed by an upthrust (UT) and a higher high, aka an upthrust after a distribution (UTAD). Quickly following this deviation is the last leg, where the asset continues to drop, signaling the formation of supply (LPSY).
Once the support levels drawn from AR and SOW are broken, the asset value plummets quickly. Interestingly, Bitcoin price is currently creating LPSY and has also formed a rising wedge, adding credence to the bearish outlook.
- Described below are potential levels where this development could lead to:
- The 30-day Exponential Moving Average (EMA) at $23,275 is the first line of defense.
- A breakdown of this level will push BTC down to support levels drawn from AR and SOW at $22,598 and $22,382, respectively.
- Beyond these barriers, investors can expect a move into the four-hour fair value gap (FVG), aka price inefficiency, at $21,440.
- The local bottom for BTC could form after a sweep of the equal lows formed at $20,750.
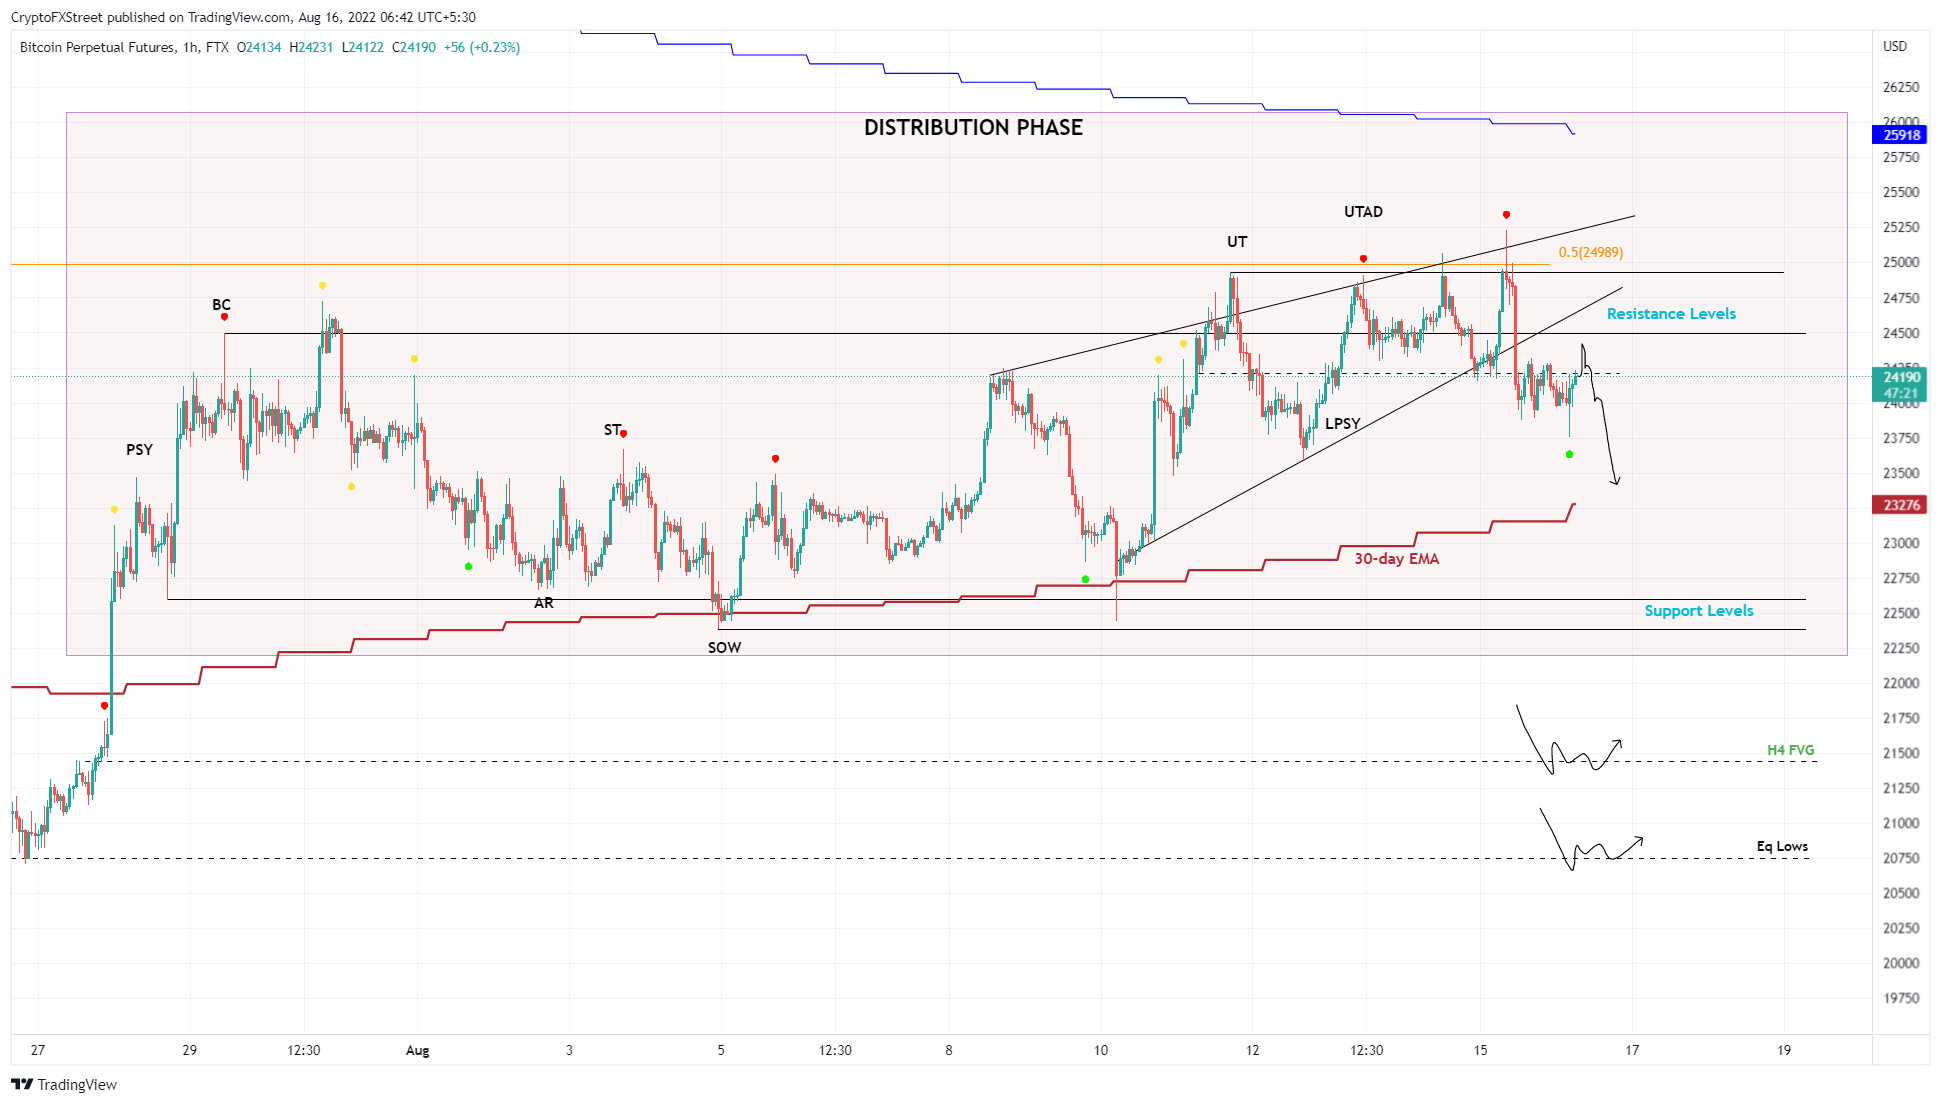
BTC/USDT 1-hour chart
While these developments from a technical perspective are undoubtedly bearish, the on-chain metrics, especially IntoTheBlock’s Global In/Out of the Money (GIOM) model, favor a bullish outlook for Bitcoin price.
The GIOM shows that the immediate support cluster, extending from $17,214 to $23,963, contains roughly 4.16 million addresses that purchased 2.56 million BTC at an average price of $21,376.
These investors are “In the Money” and are likely to buy more if BTC ever gets down to these levels.
On the other hand, the immediate resistance cluster contains 1.39 million addresses that purchased 884,690 BTC at an average price of $29,132 are “Out of the Money” This group is likely to sell to breakeven if the Bitcoin price goes higher.
Comparatively, there are more buyers “In’The Money” than “Out of the Money”, favoring a bullish outlook.
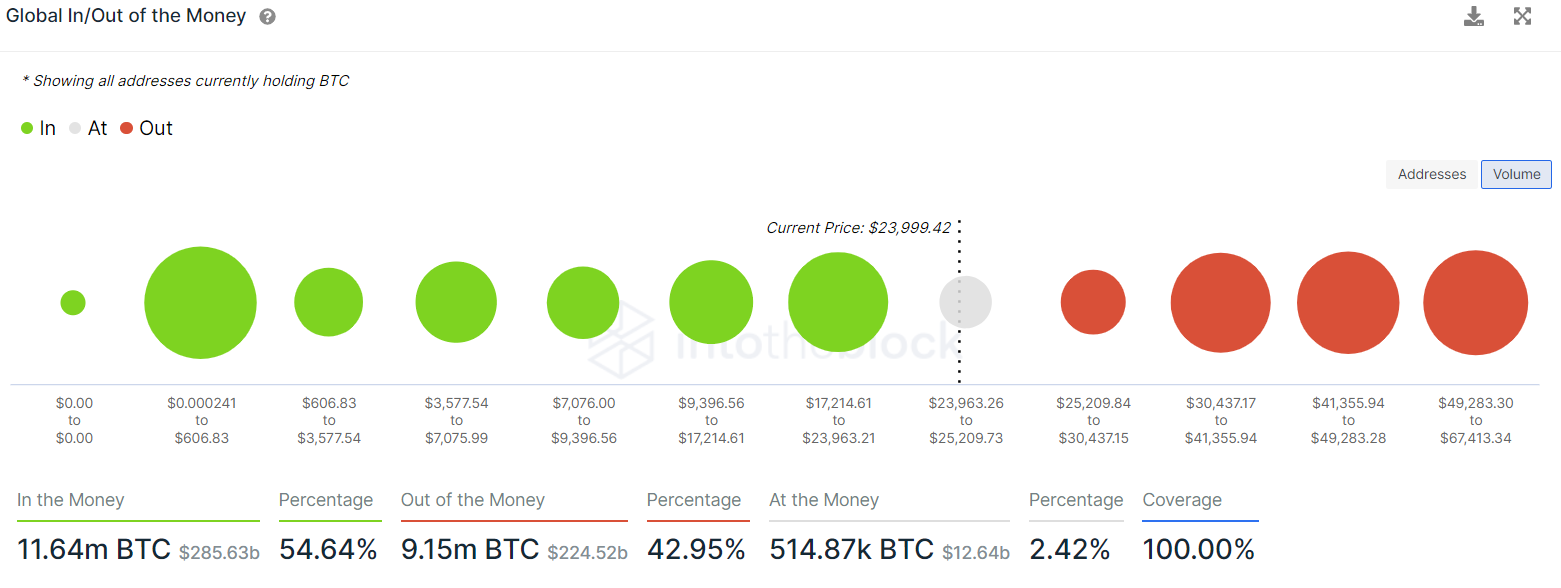
BTC GIOM
Therefore, an invalidation of the bearish thesis will occur if Bitcoin price can flip the $25,000 psychological level into a support floor. In such a case, investors can expect this move to extend to $29,000 if the buying pressure persists.
Author

Akash Girimath
FXStreet
Akash Girimath is a Mechanical Engineer interested in the chaos of the financial markets. Trying to make sense of this convoluted yet fascinating space, he switched his engineering job to become a crypto reporter and analyst.


