Is this Bitcoin price's last line of defense?
- Bitcoin price drops by 2.0%, almost erasing all gains accrued over the last seven days.
- Attention is shifting to Bitcoin's $24,000 inflection point amid rising selling pressure from the 100-day SMA.
- A bullish RSI on the daily chart upholds BTC's uptrend.

Bitcoin price started the week on a bearish note, losing roughly 2.0% of its value to exchange hands at $24,107 at the start of the American session on Monday. The flagship cryptocurrency faces a growing risk of erasing all weekly gains to retest downhill levels at $22,000 and $19,000, respectively.
Bitcoin price rejection could spell more trouble
Bitcoin price nearly brushed shoulders with $25,000 last week after the pivot point at $24,000 tipped in the bulls' favor. As reported, most analysts extended their gaze to $28,000, but Bitcoin price got rejected at the 100-day Simple Moving Average (SMA).
Two support areas are expected to come in handy – the ascending trend line and the buyers' congestion zone at $24,000. Trading below these two levels will indicate a bearish tightening grip.
The Relative Strength Index (RSI) bullish divergence is still intact; hence Bitcoin price's bearish outlook may be averted. To be safer, the RSI must stay above the up-trending line. Otherwise, investors should start acclimatizing to extended losses, first to $22,000 and later to $19,000.
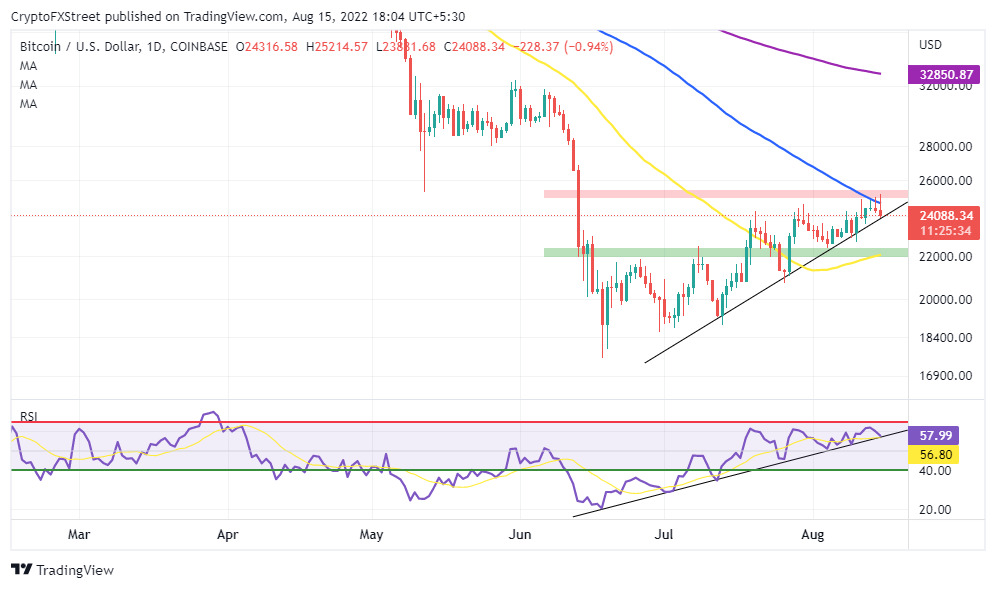
BTC/USD daily chart
Traders should not be quick to rule out the possibility of a consolidation period taking precedence between $22,000 and $25,000. The 50-day SMA reinforces the lower range limit, while the 100-day SMA fortifies the upper limit.
IntoTheBlock's IOMAP model reveals that Bitcoin price has a higher chance of dispersing the sellers in the upper range resistance – between $24,066 and $24,740 – as opposed to the robust support running from $22,650 to $23,325.
-637961691251947210.png)
Bitcoin IOMAP model
About 758,000 addresses previously purchased roughly 401,500 BTC in the upper range. If broken, Bitcoin price will have a relatively smooth path to $28,000. On the flip side, massive support is highlighted between $22,650 and $23,350.
Approximately 812,300 addresses bought roughly 644 BTC in the region. It would be a daunting task to break through this massive support, making it Bitcoin price's last line of defense.
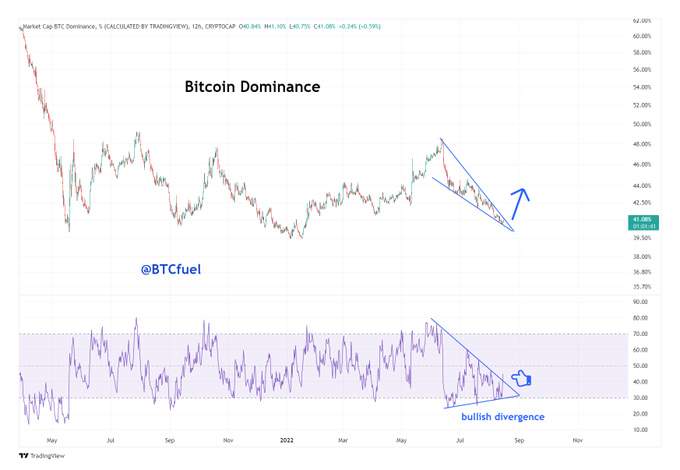
Bitcoin market dominance chart
Elsewhere, BTCfuel, a popular crypto analyst on Twitter, believes Bitcoin price remains northbound despite its struggles in its quest to $28,000. His prediction followed an analysis of the largest cryptocurrency's market dominance, which has recently formed a falling wedge. As observed on the chart above, a break above the wedge might mark the beginning of a significant turnaround for the Bitcoin price.
Author

John Isige
FXStreet
John Isige is a seasoned cryptocurrency journalist and markets analyst committed to delivering high-quality, actionable insights tailored to traders, investors, and crypto enthusiasts. He enjoys deep dives into emerging Web3 tren


