Will the Bitcoin price fool chart readers once again?
- Bitcoin price comes into a congestive zone which should resolve in an explosive move.
- BTC price has shown its untameable nature in previous congestion zones going against many classic technical analysts' expectations.
- Invalidation of the uptrend is a breach below $23,125.

Bitcoin price is notorious for making contrary directional moves in opposition to anticipated trends. Although BTC shows bearish signals in the short term, the possibility of fooling technical analysts remains on the table.
Bitcoin price has proven its untameable nature
Bitcoin price currently trades at $24,187. The peer-to-peer digital currency has been coiling within a consolidative wedge for several weeks. Many traders and analysts reading the pattern are likely considering dissension from the wedge back into $20,000 and potentially an $18,600 landing zone. Although the technicals are plausible and a short entry would be justifiable, traders should remember the nature of the Bitcoin price.
Bitcoin price has fooled some of the best analysts in recent years. In 2020, when Bitcoin traded at $7,000, Twitter was in a frenzy over the technicals. Many analysts argued that Bitcoin could not see a stable bottom on such a bearish-looking candlestick. In 2021, after Bitcoin rallied 350% to $60,000 levels, a retracement price fell to $29,000. Youtube influencers came out of the woodworks calling for a $25,000 token, which never occurred. Bitcoin price rallied back towards $69,000, totally avoiding the world's anticipated target.
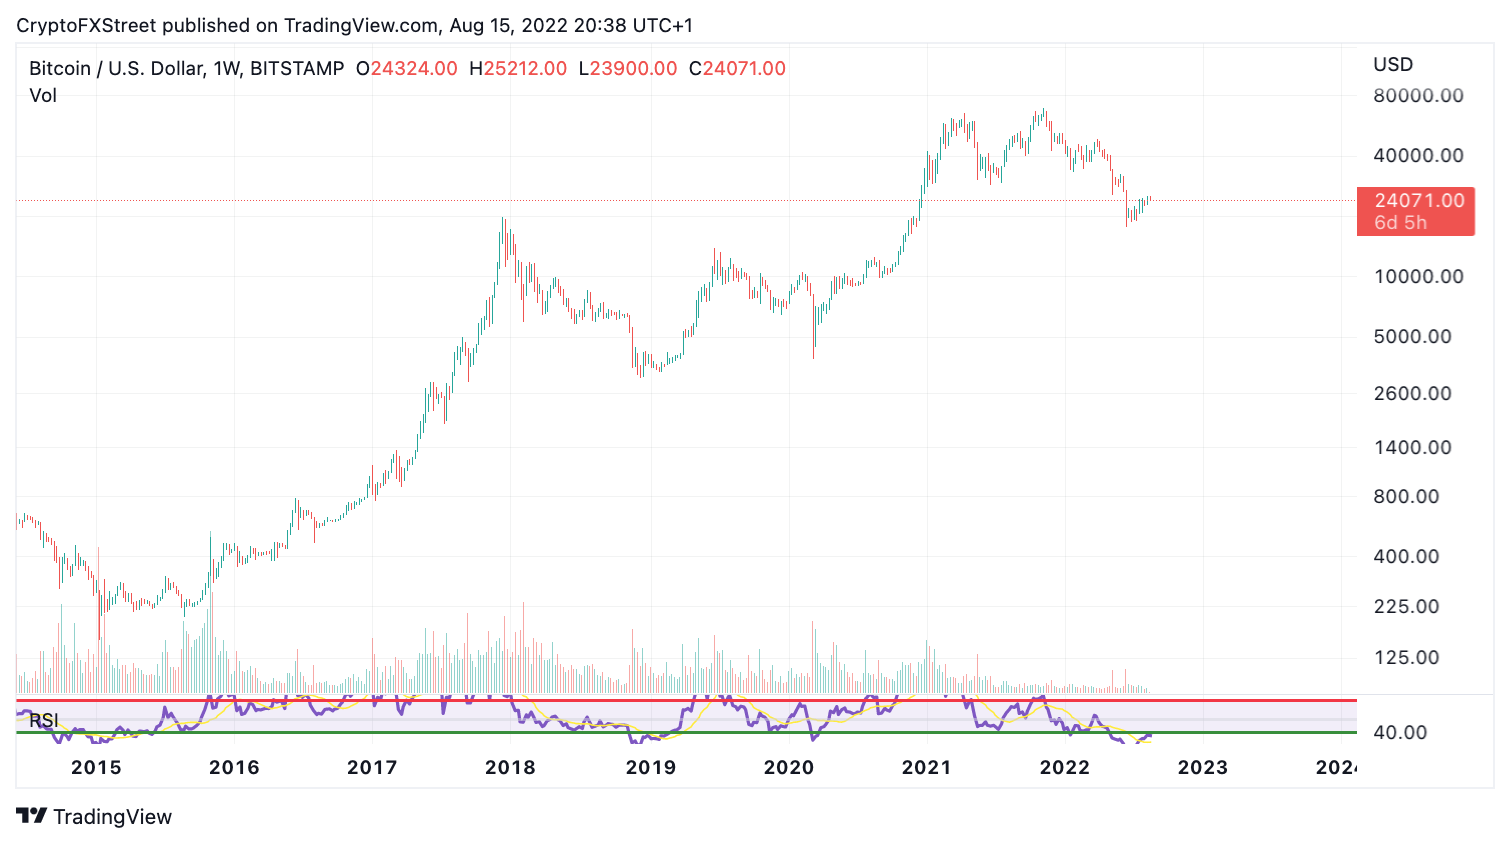
BTC/USD 1-Week Chart
Bitcoin price has proven its untameable nature during congestive price zones. Traders should be careful not to miss a move as the wedge unfolding could propel BTC price towards $27,800 in the short term. A second attempt at the $25,800 level could be the catalyst. Traders should keep in mind that invalidation of the uptrend scenario is dependent on $23,150 holding as support.
In the following video, our analysts deep dive into the price action of Bitcoin, analyzing key levels of interest in the market. -FXStreet Team
Author

Tony M.
FXStreet Contributor
Tony Montpeirous began investing in cryptocurrencies in 2017. His trading style incorporates Elliot Wave, Auction Market Theory, Fibonacci and price action as the cornerstone of his technical analysis.




