Bitcoin offers opportunity to profit as it retraces before the breakout
- Bitcoin runs another leg higher after breaking $50,000.
- Price action was stuck in a distribution phase since August 20.
- The technical launch on September 5 should spell out more upside to come.

Bitcoin price (BTC) is on the verge of breaking higher and might have a stab at the monthly R1 resistance level at $52,759.59. This comes after Bitcoin was in a distribution phase between $47,065 to the downside and $50,019 to the upside. In between these barriers, buyers and sellers were able to hand over price action toward each other. Buyers picked up BTC each time on August 26, 27, 31 and September 1.
Buyers were smart enough to defend this level from sellers pushing further to the downside and, in the meantime, sit and wait on their positions before the upside presented itself. This caused a momentum build-up and sent prices beyond $50,000 on September 2.
Looking closer at the daily price range, Bitcoin shows that sellers were not too keen to get stopped out of their short positions each time a price varied above $50,000 or tested $48,742. Only after three days, sellers forfeited, and buyers finally gained full control of the price action again.
Bitcoin will unlock more gains
The next and first port of profit-taking for Bitcoin will be the monthly R1 resistance level at $ 52,759. Expect some short-term profit-taking, but mostly the rally should stay intact. The next and most crucial level is the test of that purple ascending trend line. That line holds some historical importance, as Bitcoin has shown since July 20.
Sellers, of course, will have that ascending trend line on their bulletin board as well and will try to take over from buyers yet again. Expect price action to get choppy around those areas near $54,000.
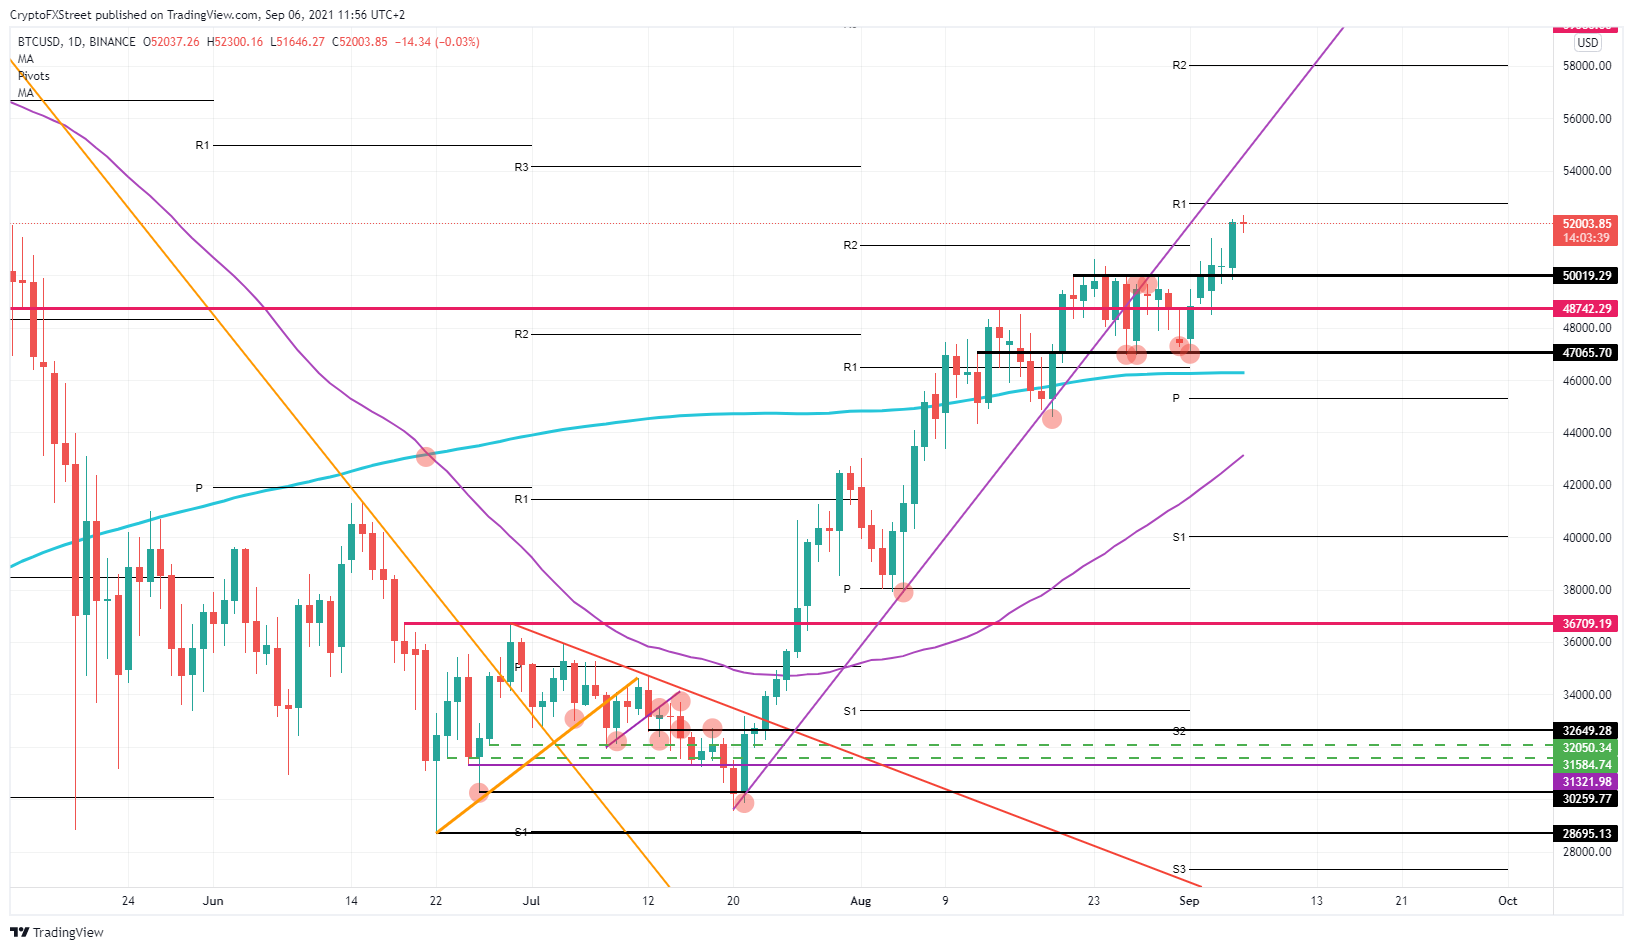
BTC/USD daily chart
In the best scenario where buyers stay in control, expect a break to the upside and a quick run toward the monthly R2 resistance level near $58,000 or roughly 12% gains.
If sellers can defend a break of the ascending purple trend line, a quick dip back toward $50,019 will be the first move sellers will make to book some quick profit. The risk could be that Bitcoin falls back into the range between $50,020 and $47,065.
Author

Filip Lagaart
FXStreet
Filip Lagaart is a former sales/trader with over 15 years of financial markets expertise under its belt.



