Bitcoin tops resistance at $51k as golden cross nears

Bitcoin looks set to continue to rise after clearing a key resistance level, with charts hinting at a so-called golden crossover, a long-term bullish indicator.
On Sunday, the biggest cryptocurrency printed a UTC close well above $51,109, marking an upside break of the 61.8% Fibonacci retracement of the April-to-June sell-off.
The breakout could bring additional demand because chart traders often use Fibonacci ratios such as 61.8%, 38.2%, and 23.6% to identify support, resistance, and trading opportunities.
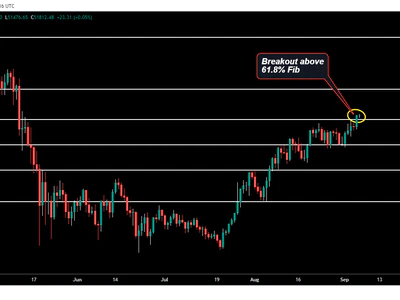
Bitcoin flips 61.8% Fib resistance into support
Last week also saw bitcoin break above other crucial hurdles at $48,644 and $49,105, Stack Funds’ Head of Research Lennard Neo said, adding that the move looks sustainable. “The fact that BTC is trading above the 200-day MA gives further confidence that these critical levels are resistances turned support,” Neo said, referring to the moving average.
“More interestingly, we have observed five out of six days of continuous bid momentum that outshine the offers. This further support the upside thesis for the digital asset, at least in the near term,” he said.
Bitcoin consolidated above the 200-day MA in the past two weeks, building a base for Sunday’s move above $50,000.
While the 200-day MA is steady near $46,100 at press time, the 50-day MA is trending north and looks set to cross above the former in the next few days. That would confirm a golden crossover, which occurs when the short-term average moves above the long-term measure.
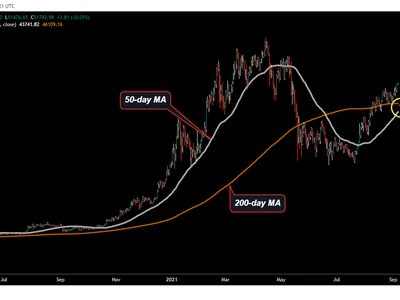
Bitcoin's golden cross
Trend-following traders consider the golden cross as a buy signal and may hit the market with fresh bids. The previous instance of the golden cross, in May 2020, was followed by an 11-month climb that saw prices rise from $9,000 to over $60,000. It’s not, however, a perfect indicator, having trapped traders on the wrong side of the market in February 2020 and July 2014.
Still, the latest golden cross is backed by bullish on-chain data showing renewed accumulation by large investors and a declining bitcoin balance on exchanges. Bitcoin is currently trading largely unchanged on the day near $51,800.
Author

CoinDesk Analysis Team
CoinDesk
CoinDesk is the media platform for the next generation of investors exploring how cryptocurrencies and digital assets are contributing to the evolution of the global financial system.



