|

Bitcoin market update: BTC/USD double-bottom pattern propels price past $12,200

  • Bitcoin spikes above $12,000 for the first time in August in fresh gains.
  • Glancing higher, Bitcoin could easily blast through $13,000 if technicals remain positively intact.

Bitcoin skyrocketed to new monthly highs during the European session on Tuesday. Piercing $12,000 is strikingly impressive for an asset that plunged to lows close to $9,000 last month. The reliable support above $9,000 continues to give Bitcoin price strong legs to sit on.

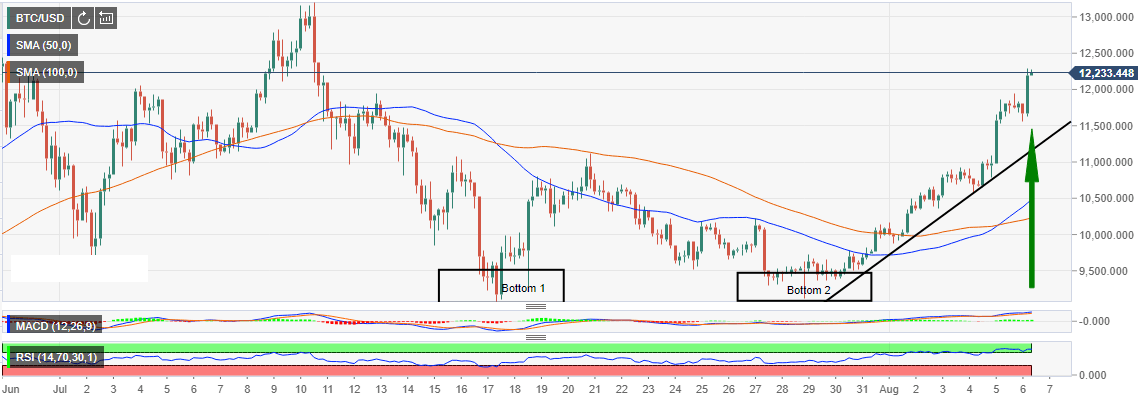
In July the $9,000 support area tested twice. A formed double-bottom pattern gave the bullish momentum a mega boost first above $10,000 and later $11,000. The tight grip by the bulls saw Bitcoin price step above $11,500, which later saw the price action above the critical $12,000 level. Glancing higher, Bitcoin squeezed through $12,000 for the first time in August.

Also read: Ethereum price analysis: ETH/USD squeezes through $230 the second time in 2 days

At press time, BTC/USD teeters at $12,229 amid a struggled to secure higher support, preferably above $12,200. Looking at the technical indicators, Bitcoin is inclined to push towards $13,000 in the coming sessions. The Relative Strength Index (RSI) at 84.37 is sideways in the overbought. The Moving Average Convergence Divergence (MACD) gradually slopes upwards in the midst increasing bullish divergence.

BTC/USD 4-hour chart
Author

John Isige

John Isige

FXStreet

John Isige is a seasoned cryptocurrency journalist and markets analyst committed to delivering high-quality, actionable insights tailored to traders, investors, and crypto enthusiasts. He enjoys deep dives into emerging Web3 tren


More from John Isige
Share:

Editor's Picks

Bitcoin Weekly Forecast: BTC retreats as macro headwinds grow
Bitcoin (BTC) remains under pressure, down over 4% this week and trading around $76,900 at the time of writing on Friday. Institutional demand shows signs of weakness as spot BTC Exchange Traded Funds (ETFs) are on track to end their three-week inflow streak, recording nearly $500 million in net outflows through Thursday.
XRP falls toward key support as macro uncertainty, weak momentum cap recovery
Ripple (XRP) falls below $1.33 on Friday, marking the third consecutive day of declines. The token continues to track the broader cryptocurrency market downturn, with investors closely monitoring heightened macroeconomic uncertainty ahead of the United States (US) Consumer Price Index (CPI) release and next week’s Federal Reserve (Fed) monetary policy decision.
Crypto Today: Bitcoin, Ethereum, XRP stabilize at lower levels amid ETF outflows and macroeconomic risks
The broader cryptocurrency market is rising on Friday, with Bitcoin (BTC) trading above $77,000 after testing lower support near $76,500. Ethereum (ETH) shows signs of stability, hovering above the support provided at $2,400 despite capped upside at $2,500. Meanwhile, Ripple (XRP) holds above $1.33 after three straight days of declines, reflecting growing headwinds due to macroeconomic uncertainty.
Bitcoin pulls back as another golden cross fails to deliver
Earlier this week, Bitcoin formed a golden cross, a technical signal that occurs when the price’s 50-day moving average rises above the 200-day moving average and is conventionally viewed as a precursor to a bullish rally. Historically, however, that’s often not been the case.
Bitcoin: BTC retreats as macro headwinds grow
Bitcoin (BTC) remains under pressure, down over 4% this week and trading around $76,900 at the time of writing on Friday. Institutional demand shows signs of weakness as spot BTC Exchange Traded Funds (ETFs) are on track to end their three-week inflow streak, recording nearly $500 million in net outflows through Thursday.


