Ethereum price analysis: ETH/USD squeezes through $230 the second time in 2 days
- Ethereum pierces $230 as Bitcoin scales the levels above $12,000.
- Moving averages form the immediate support areas as Ethereum seeks higher consolidation.

Ethereum is said to be breaking away from the altcoins to become an independent cryptocurrency like Bitcoin. However, at the moment the second largest crypto is still reacting to Bitcoin price actions. For instance, as Bitcoin pierced $12,000 today, Ethereum price zoomed above $230 resistance.
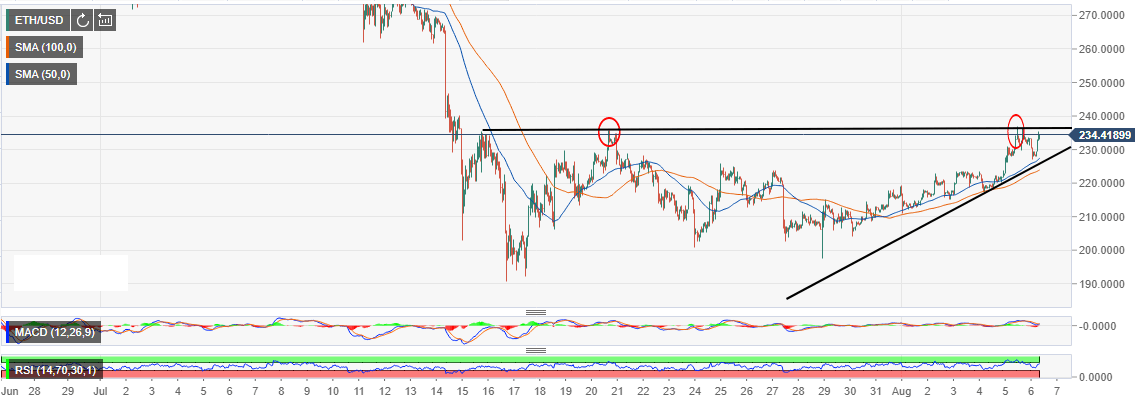
The hourly chart places Ethereum at above the moving averages where the 50 Simple Moving Average offers support at $227.78 while the 100 SMA at $224.50 (slightly below the trendline support). In the event of a reversal from the current market value at $233.94, other key support areas traders can lookout for range from $220, $210 and the major support at $200.
The impeccable recovery on Tuesday hit a high slightly below yesterday’s $237.33 at $235.85 (intraday high). In turn, a double top pattern formed with the highs achieved on July 20. The reaction to this price pushed Ethereum to the intraday low at $227.19 (with the downside supported by the above-mentioned 50 SMA).
At press time, the prevailing trend is strongly positive. The Relative Strength Index (RSI) is on verge of piercing into the overbought. The upward direction is a key indicator of the growing bullish momentum. Besides, the Moving Average Convergence Divergence (MACD) sustains its position in the positive territory. Moreover, the growing bullish divergence means that Ethereum is likely to correct higher if not formed support above $230 in the near-term.
ETH/USD 1-hour chart
Author

John Isige
FXStreet
John Isige is a seasoned cryptocurrency journalist and markets analyst committed to delivering high-quality, actionable insights tailored to traders, investors, and crypto enthusiasts. He enjoys deep dives into emerging Web3 tren