Bitcoin, Ethereum, and XRP can fall lower, crypto investors not in panic mode just yet
- The crypto fear and greed index shows investors are experiencing fear but not up to historic levels.
- BTC, ETH, and XRP need to hold some crucial support levels to avoid further losses.

The crypto fear and greed index has been an accurate indicator of tops and bottoms. On March 13, the fear index hit 10, a level close to the lowest ever on August 22 at 5. The entire crypto market had a bullish rally after the index hit 10, gaining more than $200 billion in market capitalization over the next few months.
Crypto Fear & Greed Index
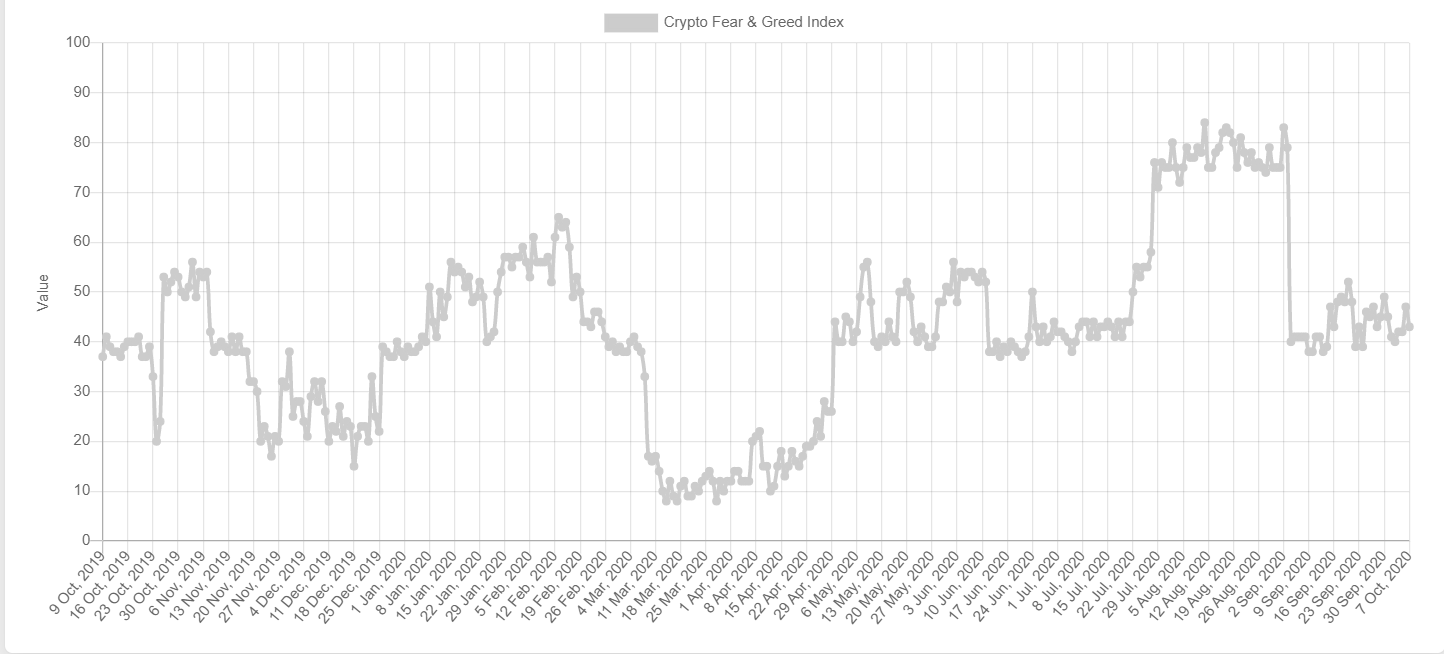
Although the indicator shows some fear now, we know this metric can be far more extreme, which means there is potential for the market to see further losses before a recovery.
Can Bitcoin hold this critical support level?
Since the massive 15% drop on September 3 towards $10,000, Bitcoin has defended a critical support level in the form of the 100-SMA. Although BTC’s price has pierced below the 100-SMA a few times in the past, it always managed to recover the next day, which makes this support point the most critical in the short-term.
BTC/USD daily chart
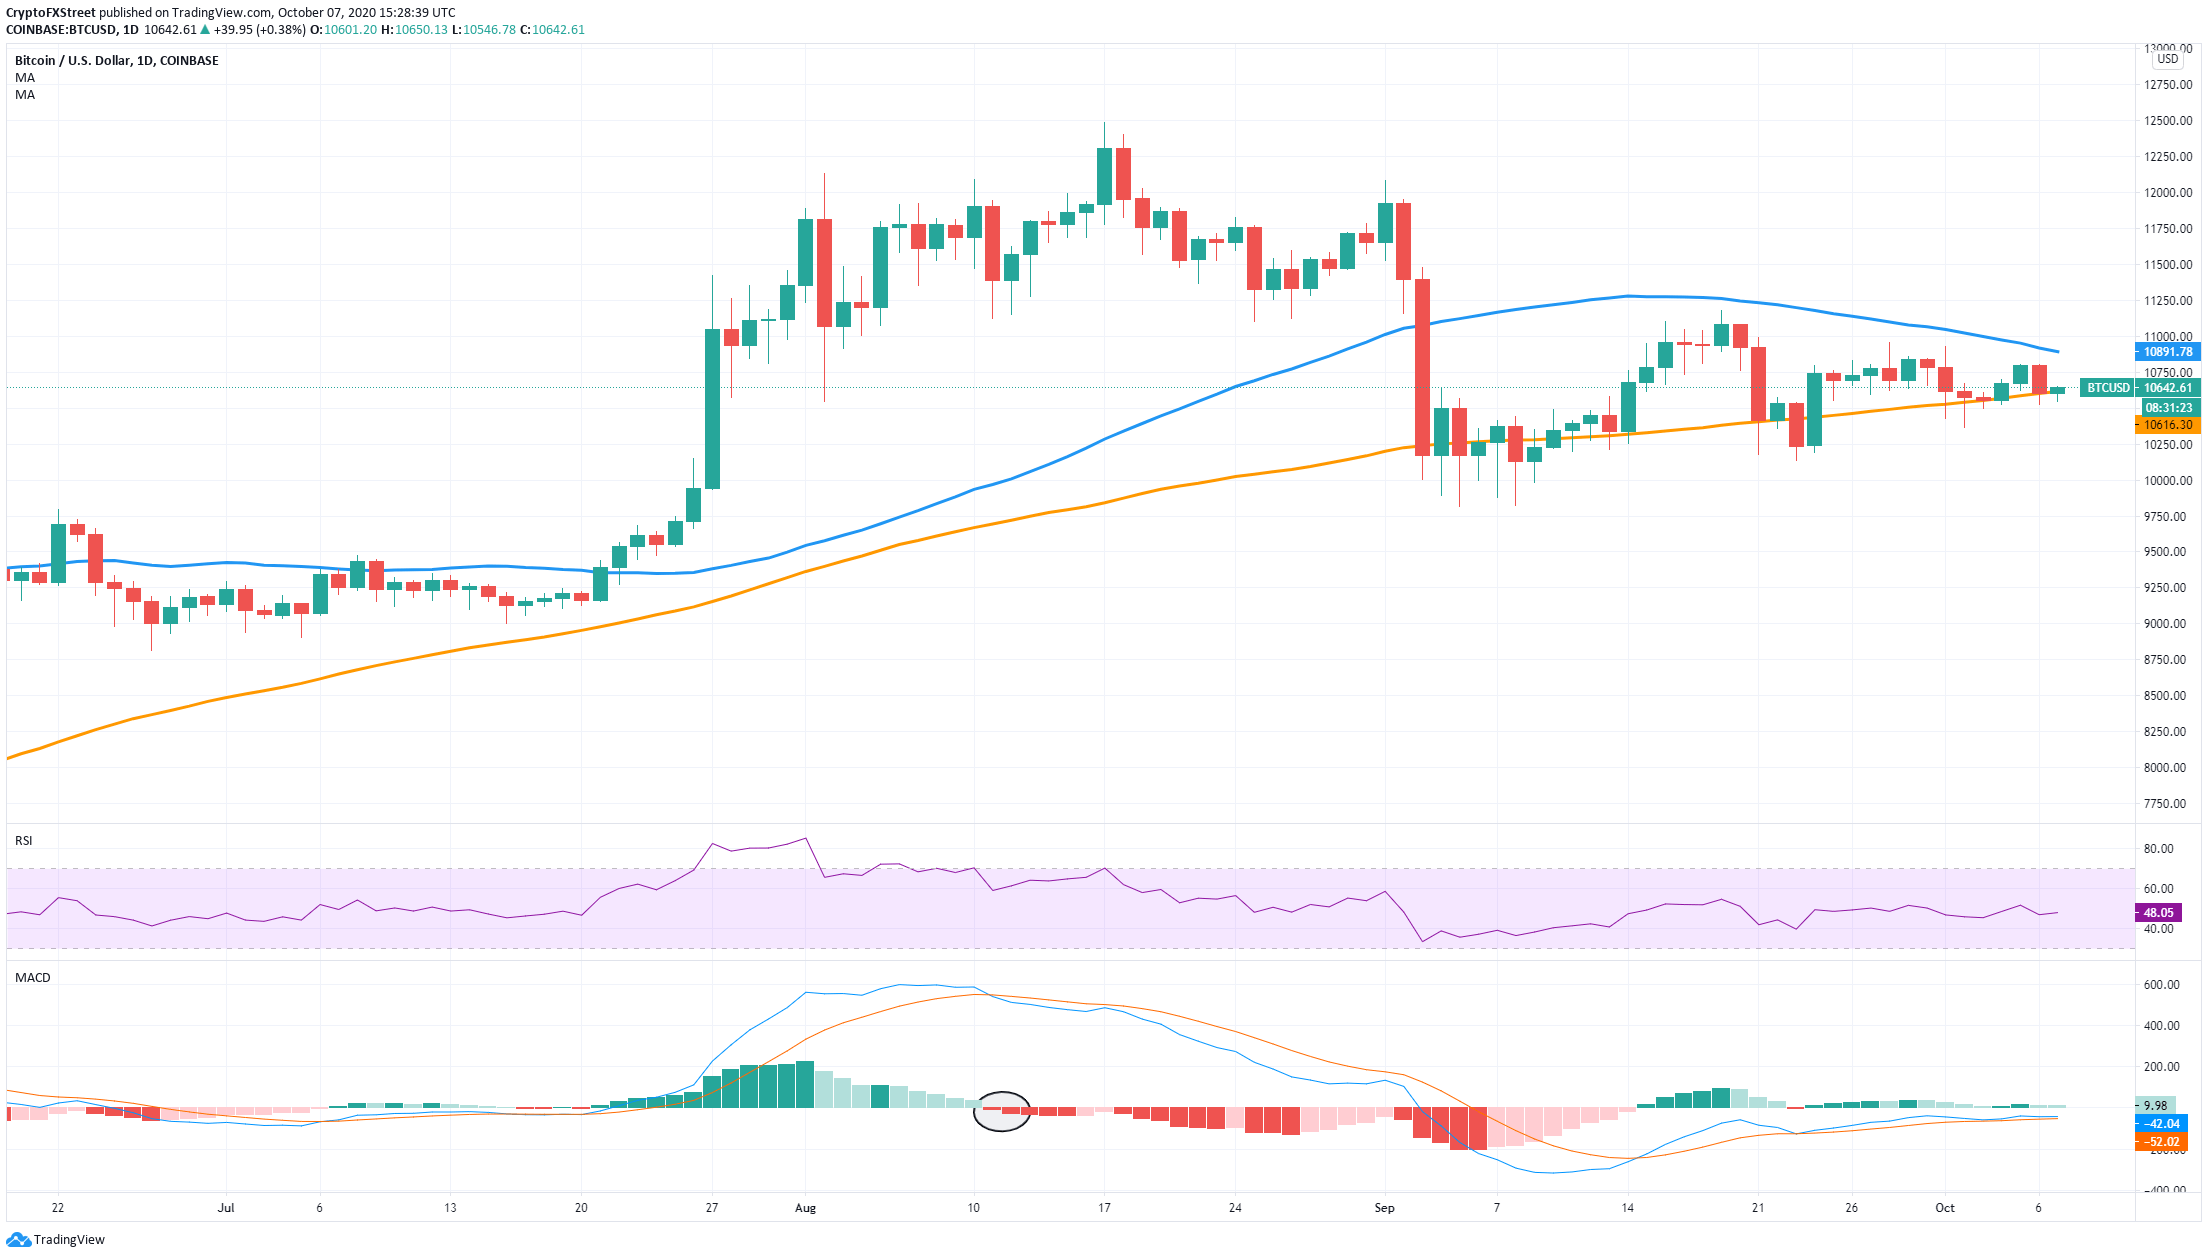
A breakout below the 100-SMA would be a devastating blow for the bulls and will turn the MACD bearish for the first time since August 11, right before the peak at $12,486.
BTC IOMAP Chart
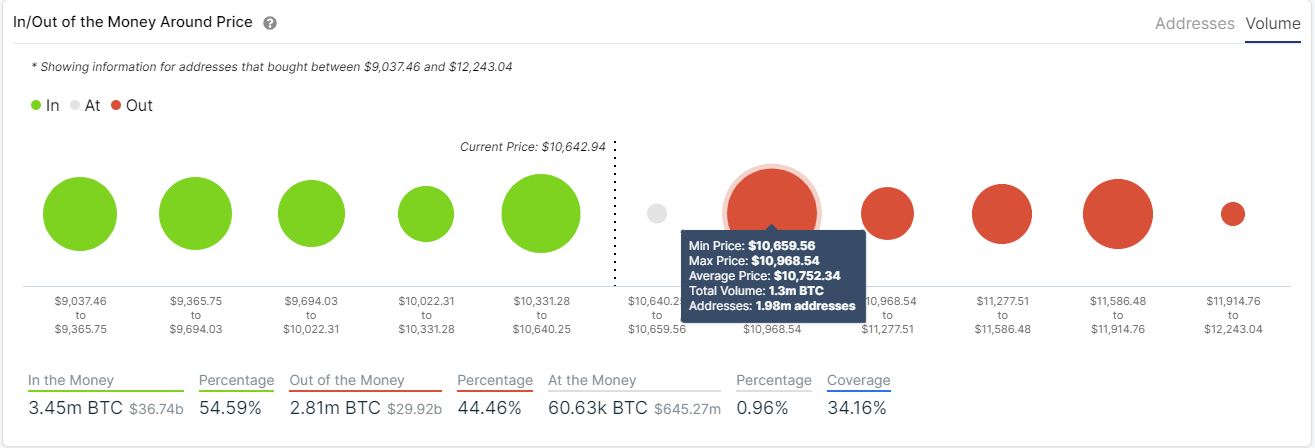
The In/Out of the Money Around Price chart by IntoTheBlock shows stronger resistance than support judging by the number of Bitcoin bought at different price ranges. For instance, between $10,659 and $10,968, close to 1.3 million BTC was bought. On the other hand, only 916,000 BTC was purchased in the $10,331 - $10,640 range.
After a bearish breakout, the next target price would be $10,000, which was established as a robust psychological level between September 3 and September 9 and throughout a big part of 2020, acting as a resistance level.
On the flip side, if the flagship cryptocurrency can defend the 100-SMA on the daily chart, it would most likely climb above $10,650, where the 50-SMA and the 100-SMA on the 4-hour chart are established.
BTC/USD 4-hour chart
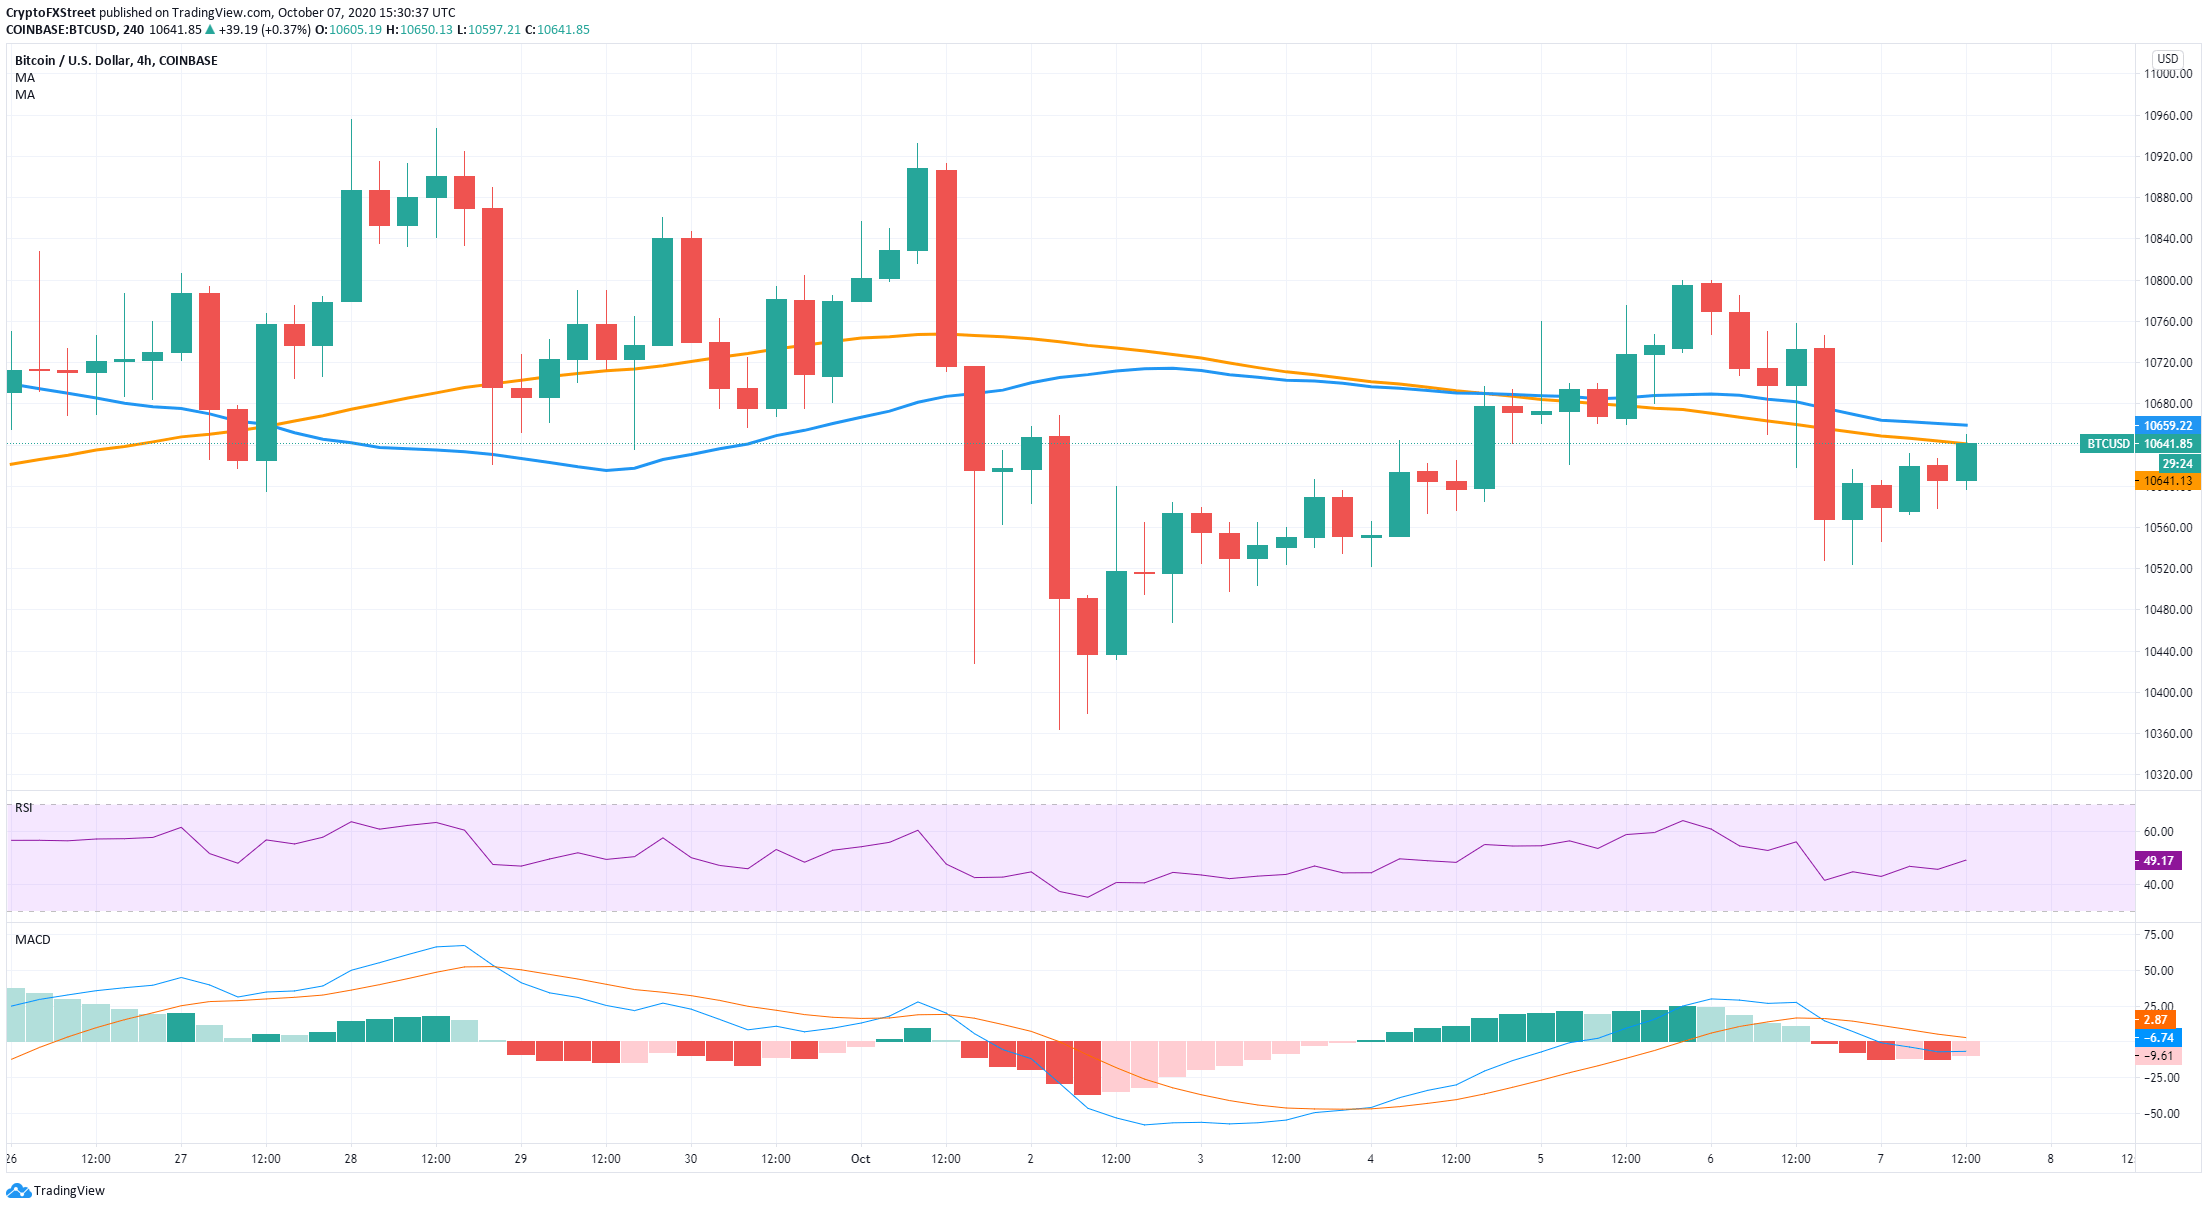
The MACD here is slowly turning bullish again, while Bitcoin fights to transform both SMAs into support levels. A bullish breakout will push BTC towards $11,000 to re-test the psychological level.
Ethereum’s short-term fate depends on this indicator
On the daily chart, Ethereum is trading inside a falling wedge and right where the 100-SMA currently stands at $342. Like Bitcoin, ETH bulls need to hold this support level if they want to see a bounce towards the wedge's upper boundary at $355.
ETH/USD daily chart
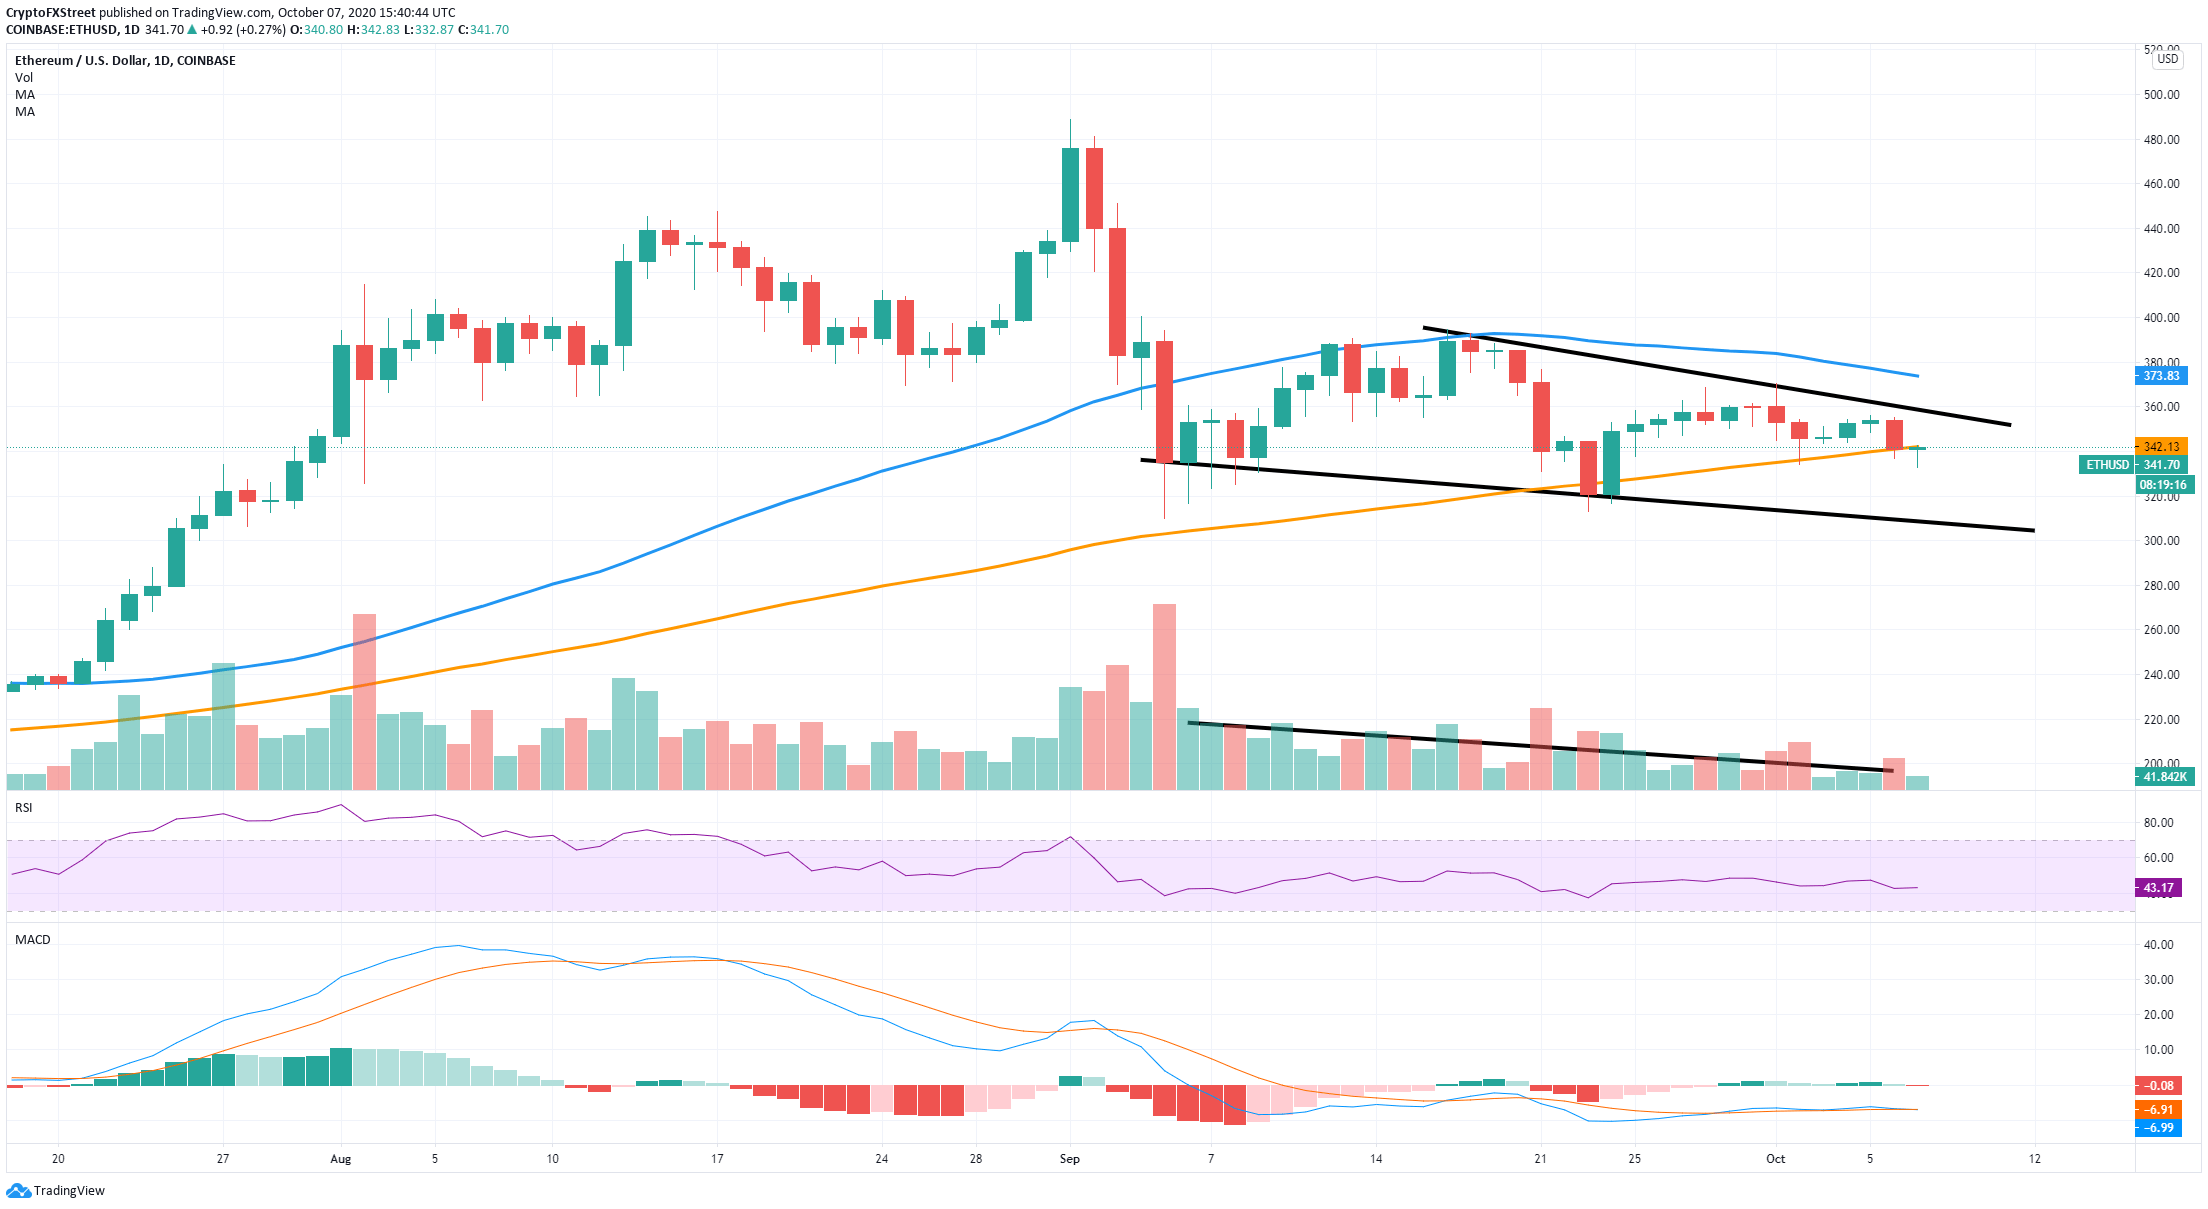
The apparent decline in trading volume is a good indication that a breakout from the falling wedge is underway. On the shorter time-frames like the 4-hour chart, Ethereum managed to defend a support level established on October 2 at $337.
ETH/USD 4-hour chart
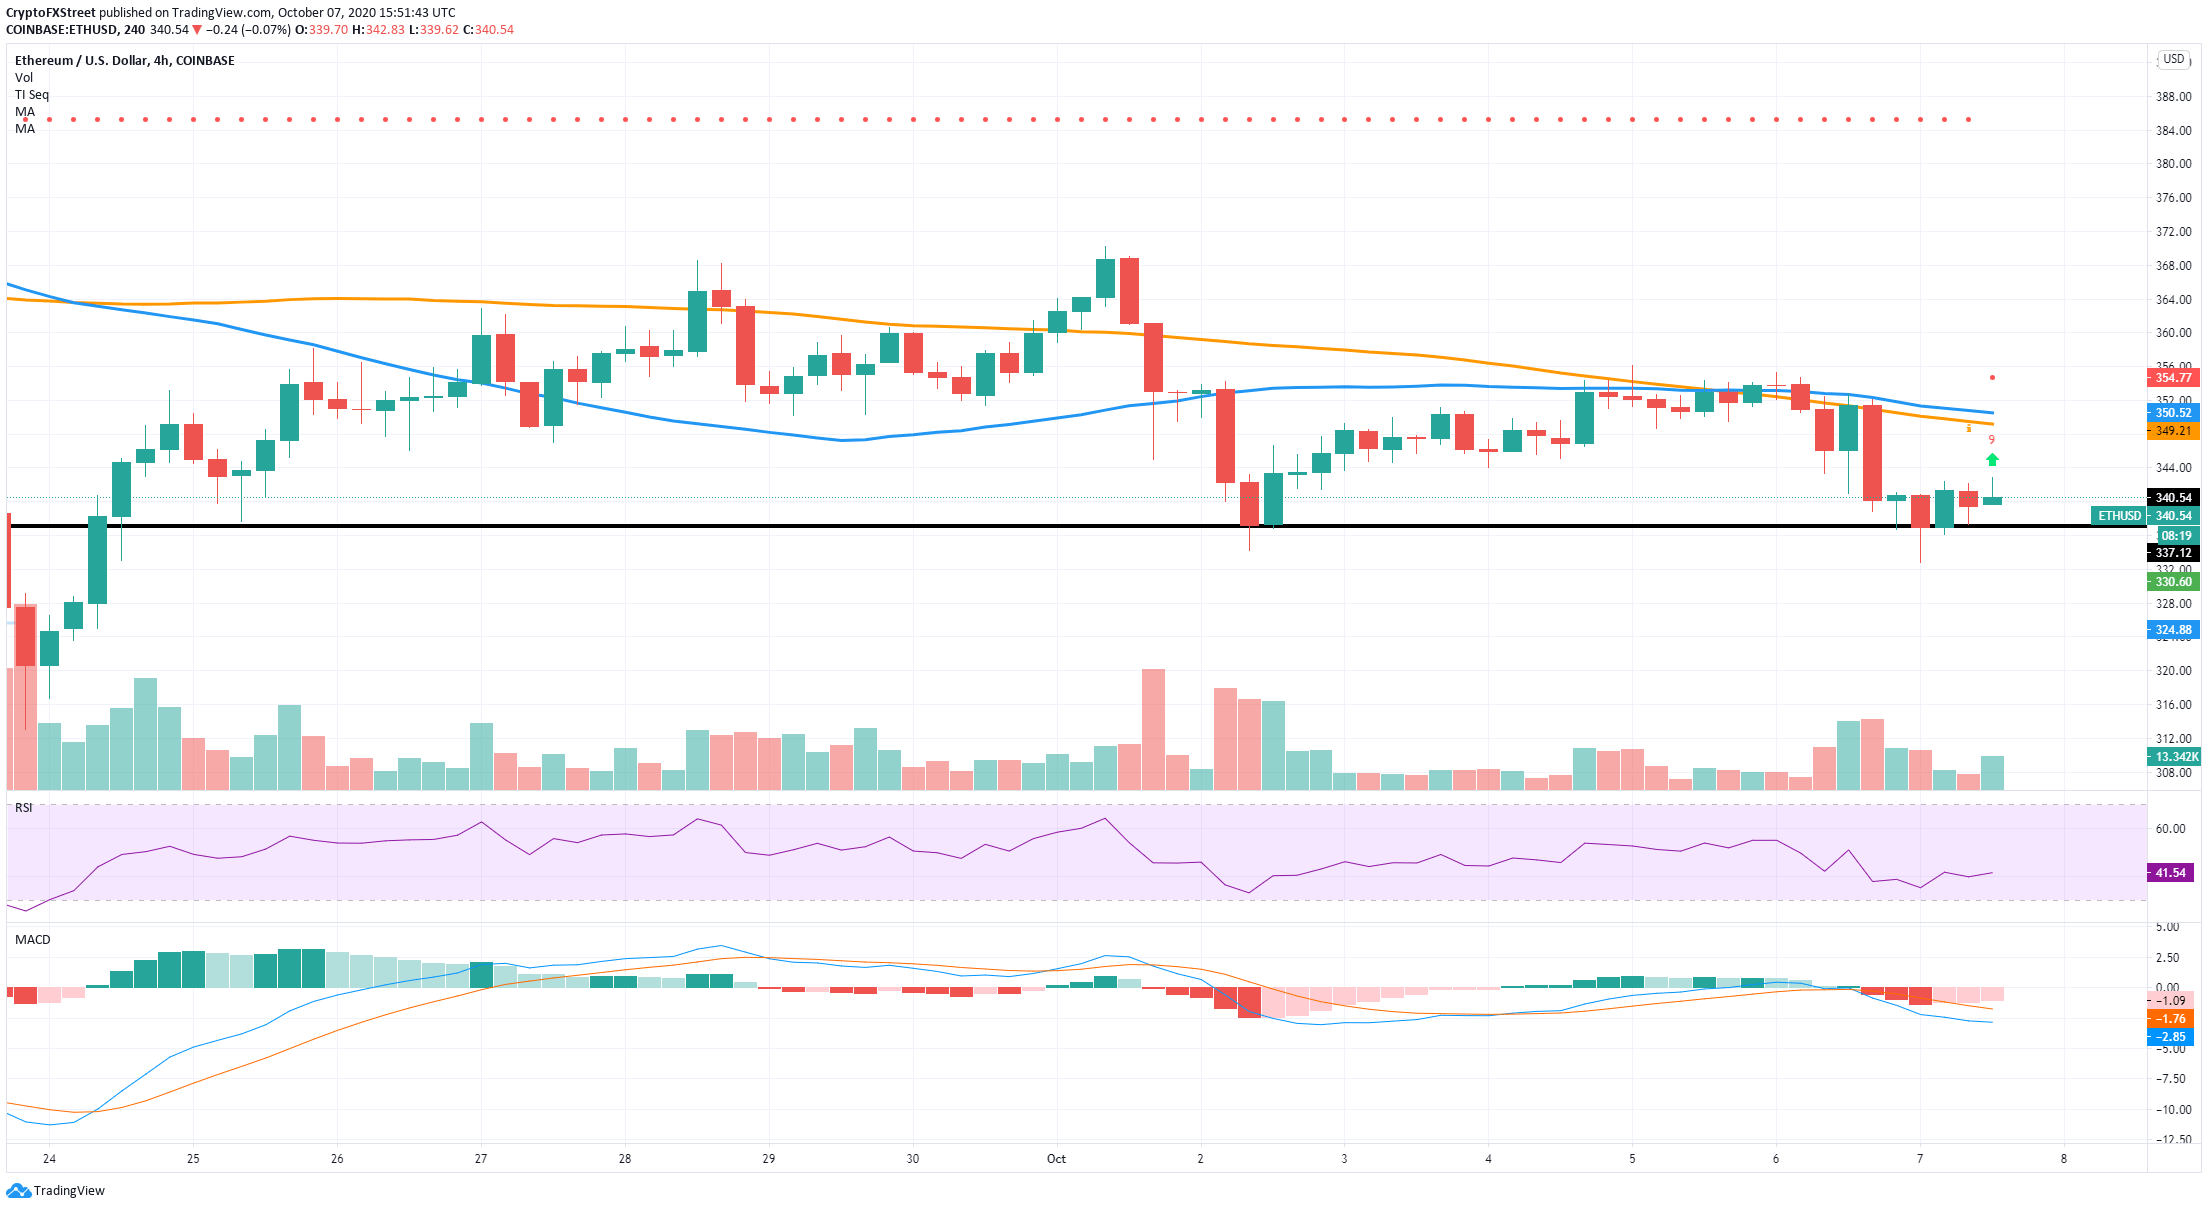
The TD sequential indicator presented a strong buy signal. On the other hand, several on-chain metrics are suggesting Ethereum might be poised for further losses.
ETH New Addresses Chart
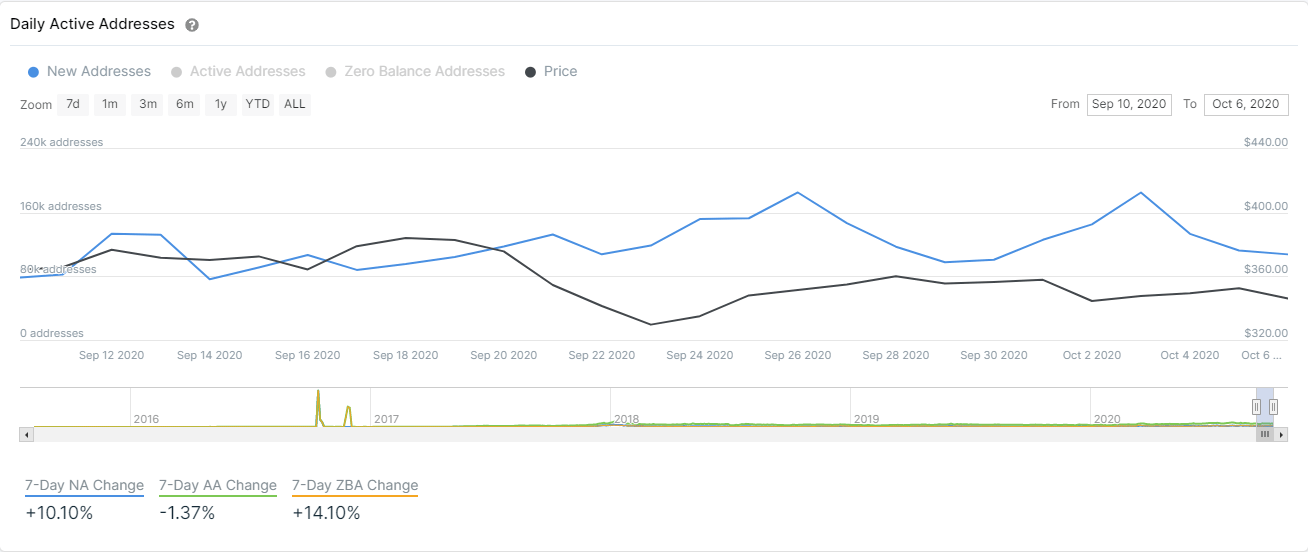
The number of new addresses joining the Ethereum network dropped from a high of 185,000 on October 3 to only 107,000 now. The metric shows a lack of interest in ETH despite the price decline.
ETH IOMAP Chart
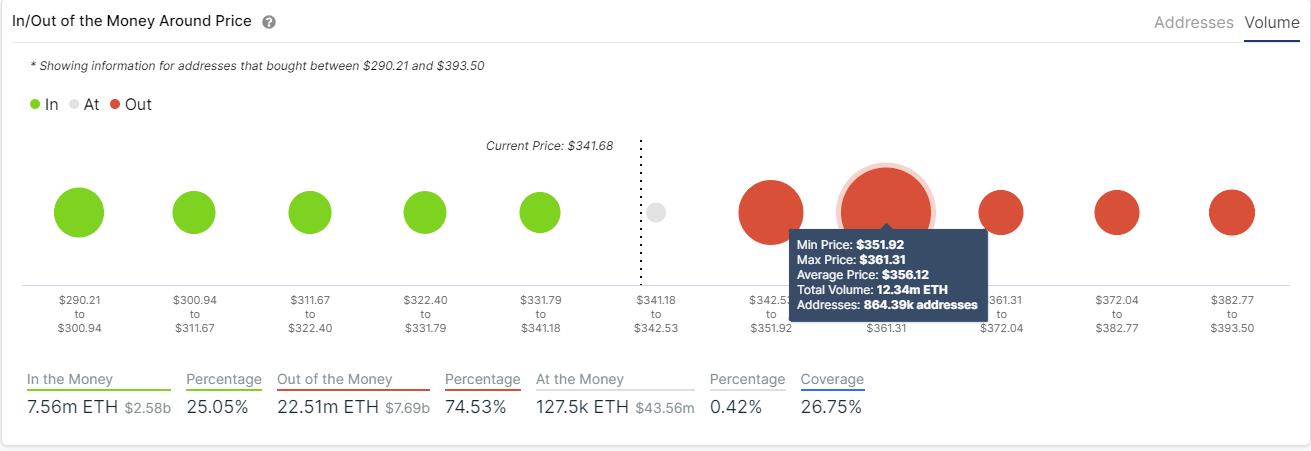
Additionally, the IOMAP chart shows steep resistance ahead in comparison to support. The range between $351 and $361 is a strong resistance area with 12 million ETH bought. If we compare that volume to the one between $341-290, which only has 7.5 million, we can see a massive difference and a lot of selling pressure.
A breakout below the $337 support level will push Ethereum down to $300 in the short-term.
XRP’s most recent rejection hints at further losses
As discussed in our most recent analysis for XRP, the digital asset could see a drop towards $0.215 due to the most recent rejection from the daily descending parallel channel.
Another concerning trend was the decrease in the number of XRP whales. Metrics from Santiment indicated that holders with 1,000,000 - 10,000,000 coins are slowly exiting from 1338 whales on October 4 to 1336. The number of whales with at least 10,000,000 coins also dropped from 313 on October 2 to only 309.
The 100-SMA support level remains the most important one in the short-term, with XRP either slipping to $0.23 or re-testing $0.254 if the support holds.
Author

Lorenzo Stroe
Independent Analyst
Lorenzo is an experienced Technical Analyst and Content Writer who has been working in the cryptocurrency industry since 2012. He also has a passion for trading.



