• XRP price managed to see a breakout above an important daily pattern; however, it ended up becoming a fakeout.
  • The recent rejection has the potential to push XRP down to $0.215 in the short-term.

XRP was outperforming the crypto market in the past few days, especially after the most recent bullish breakout of the daily descending parallel channel. Unfortunately, the breakout turned out to be a fakeout, and the price got rejected.

What is the fate of XRP in the short-term?

The rejection from the upper boundary of the daily descending parallel channel and the 50-SMA is significant. Currently, XRP is re-testing the 100-SMA. However, this rejection is notable and will most likely drop the digital asset even below the 100-SMA at $0.244. 

XRP/USD daily chart

xrp price

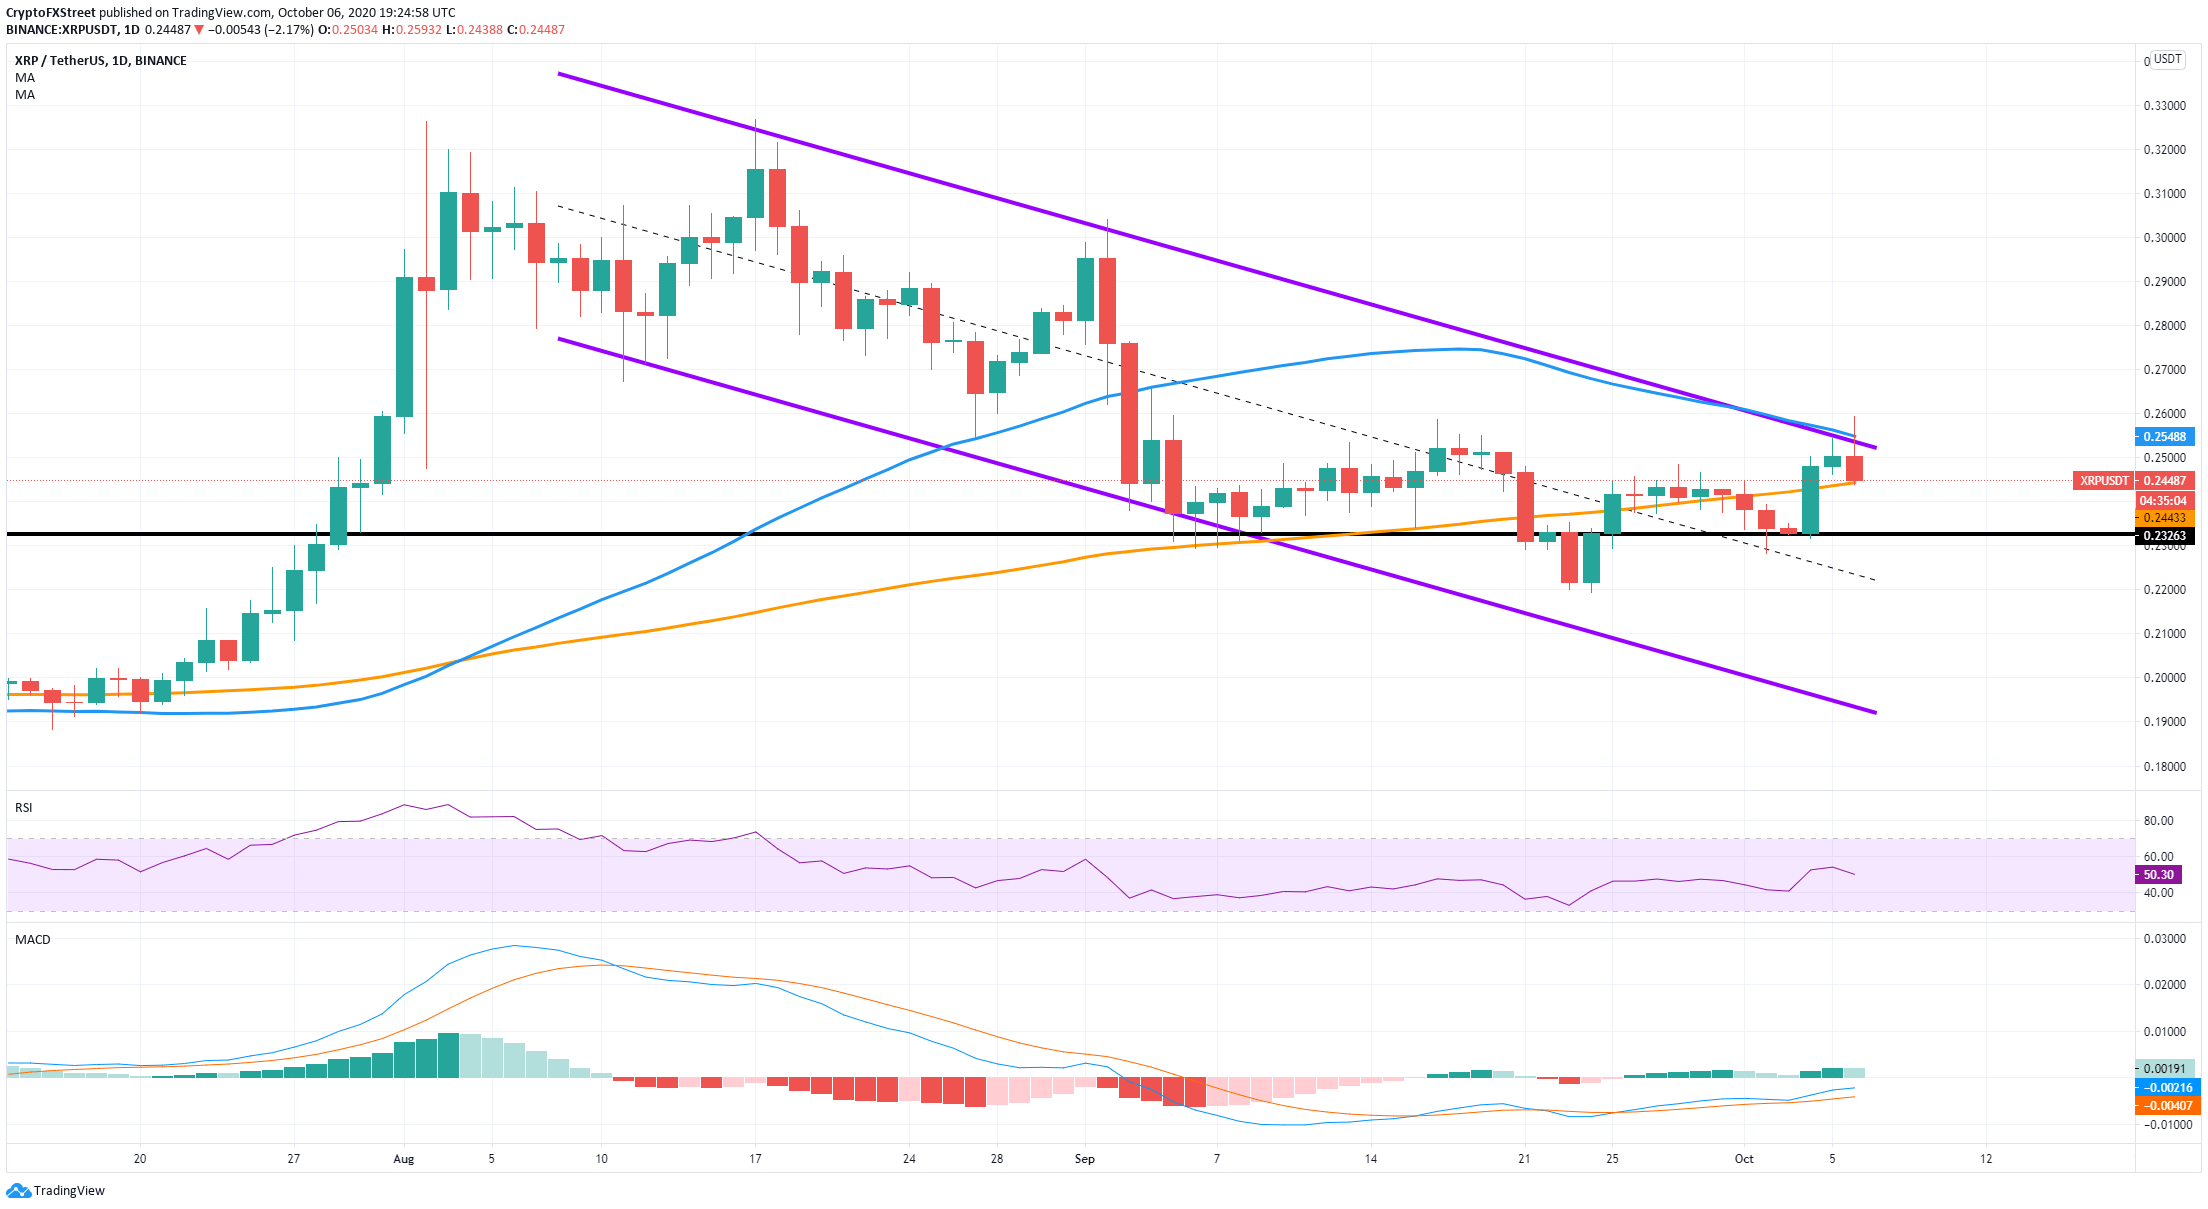
The next support level would be $0.232, formed on October 3. On the shorter time-frames like the hourly chart, we can observe a trend change. XRP formed a high at $0.259, followed by a lower high at $0.254. It also established a low at $0.253 and then a lower low at $0.245, the current price.

XRP/USD 1-hour chart

xrp price

This downtrend is now headed for the 100-SMA at $0.242. The MACD turned bearish this morning, and it’s getting stronger, indicating that further selling pressure will follow. Bad news doesn’t stop there. 

XRP Holders Distribution

xrp price

If we look at the distribution of XRP whales, we can see that the downtrend continues. Holders with 1,000,000 - 10,000,000 coins are slowly exiting from 1338 whales on October 4 to 1336 now. Similarly, the number of whales with at least 10,000,000 coins dropped from 313 on October 2 to only 309. 

Despite all the negative factors, XRP bulls still have a chance to come back. The daily chart has established a healthy support level in the form of the 100-SMA. A successful defense of this level could prompt XRP to re-test the 50-SMA and the upper boundary of the descending parallel channel.

Both buyers and sellers need to focus on the 100-SMA and the 50-SMA. If $0.244 breaks, XRP can easily slip towards $0.23. On the other hand, if it holds, we could see a re-test of $0.254 where the 50-SMA stands on the daily chart.


Note: All information on this page is subject to change. The use of this website constitutes acceptance of our user agreement. Please read our privacy policy and legal disclaimer. Opinions expressed at FXstreet.com are those of the individual authors and do not necessarily represent the opinion of FXstreet.com or its management. Risk Disclosure: Trading foreign exchange on margin carries a high level of risk, and may not be suitable for all investors. The high degree of leverage can work against you as well as for you. Before deciding to invest in foreign exchange you should carefully consider your investment objectives, level of experience, and risk appetite. The possibility exists that you could sustain a loss of some or all of your initial investment and therefore you should not invest money that you cannot afford to lose. You should be aware of all the risks associated with foreign exchange trading, and seek advice from an independent financial advisor if you have any doubts.

Join Telegram

Recommended content


Recommended Content

Editors’ Picks

Ripple wipes out weekly gains, experts comment on role of Ripple stablecoin

Ripple wipes out weekly gains, experts comment on role of Ripple stablecoin

Ripple declined to $0.52 on Thursday, erasing all gains registered earlier this week. Ripple SVP Eric van Miltenburg’s comments on the firm’s stablecoin, and how it is expected to benefit the XRP Ledger and native token XRP have raised concerns among crypto experts. 

More Ripple News

Hedera HBAR slips nearly 10% after air is cleared on mistaken link with giant BlackRock

Hedera HBAR slips nearly 10% after air is cleared on mistaken link with giant BlackRock

HBAR price is down nearly 10% on Thursday, partly erasing gains inspired by the misinterpreted link with BlackRock. Despite the recent correction, Hedera’s price is up 44% in the past seven days.

More Hedera News

The reason behind Bonk’s 105% rise and if you should buy now Premium

The reason behind Bonk’s 105% rise and if you should buy now

Bonk price has shot up 105% in the past five weeks. A retracement into $0.0000216 or the $0.0000152 to $0.0000186 imbalance would be a good buying opportunity. Patient investors can expect double-digit gains from BONK that could extend up to 70%.

More Cryptocurrencies News

Injective price weakness persists despite over 5.9 million INJ tokens burned

Injective price weakness persists despite over 5.9 million INJ tokens burned

Injective price is trading with a bearish bias, stuck in the lower section of the market range. The bearish outlook abounds despite the network's deflationary efforts to pump the price. Coupled with broader market gloom, INJ token’s doomed days may not be over yet.

More Injective News

Bitcoin: BTC post-halving rally could be partially priced in Premium

Bitcoin: BTC post-halving rally could be partially priced in

Bitcoin (BTC) price briefly slipped below the $60,000 level for the last three days, attracting buyers in this area as the fourth BTC halving is due in a few hours. Is the halving priced in for Bitcoin? Or will the pioneer crypto note more gains in the coming days? 

Read full analysis

BTC

ETH

XRP