|

Bitcoin Cash Price Forecast: BCH traders can bank on short-term bounce to $228

  • Bitcoin Cash price could trigger a small move to $228.
  • There is a chance that investors might get an opportunity to accumulate at $197. 
  • Invalidation of the bullish thesis will occur on the breakdown of the $197 support level on the daily time frame. 

Bitcoin Cash (BCH) price presents an opportunity that could profit traders who are bullish on the short term. Additionally, investors might get a better chance to accumulate due to a pullback to a key support level. 

Also read: Week Ahead: No ETFs, but crypto markets might be preparing for a quick rally ahead of Powell's speech

Bitcoin Cash price ready to move higher

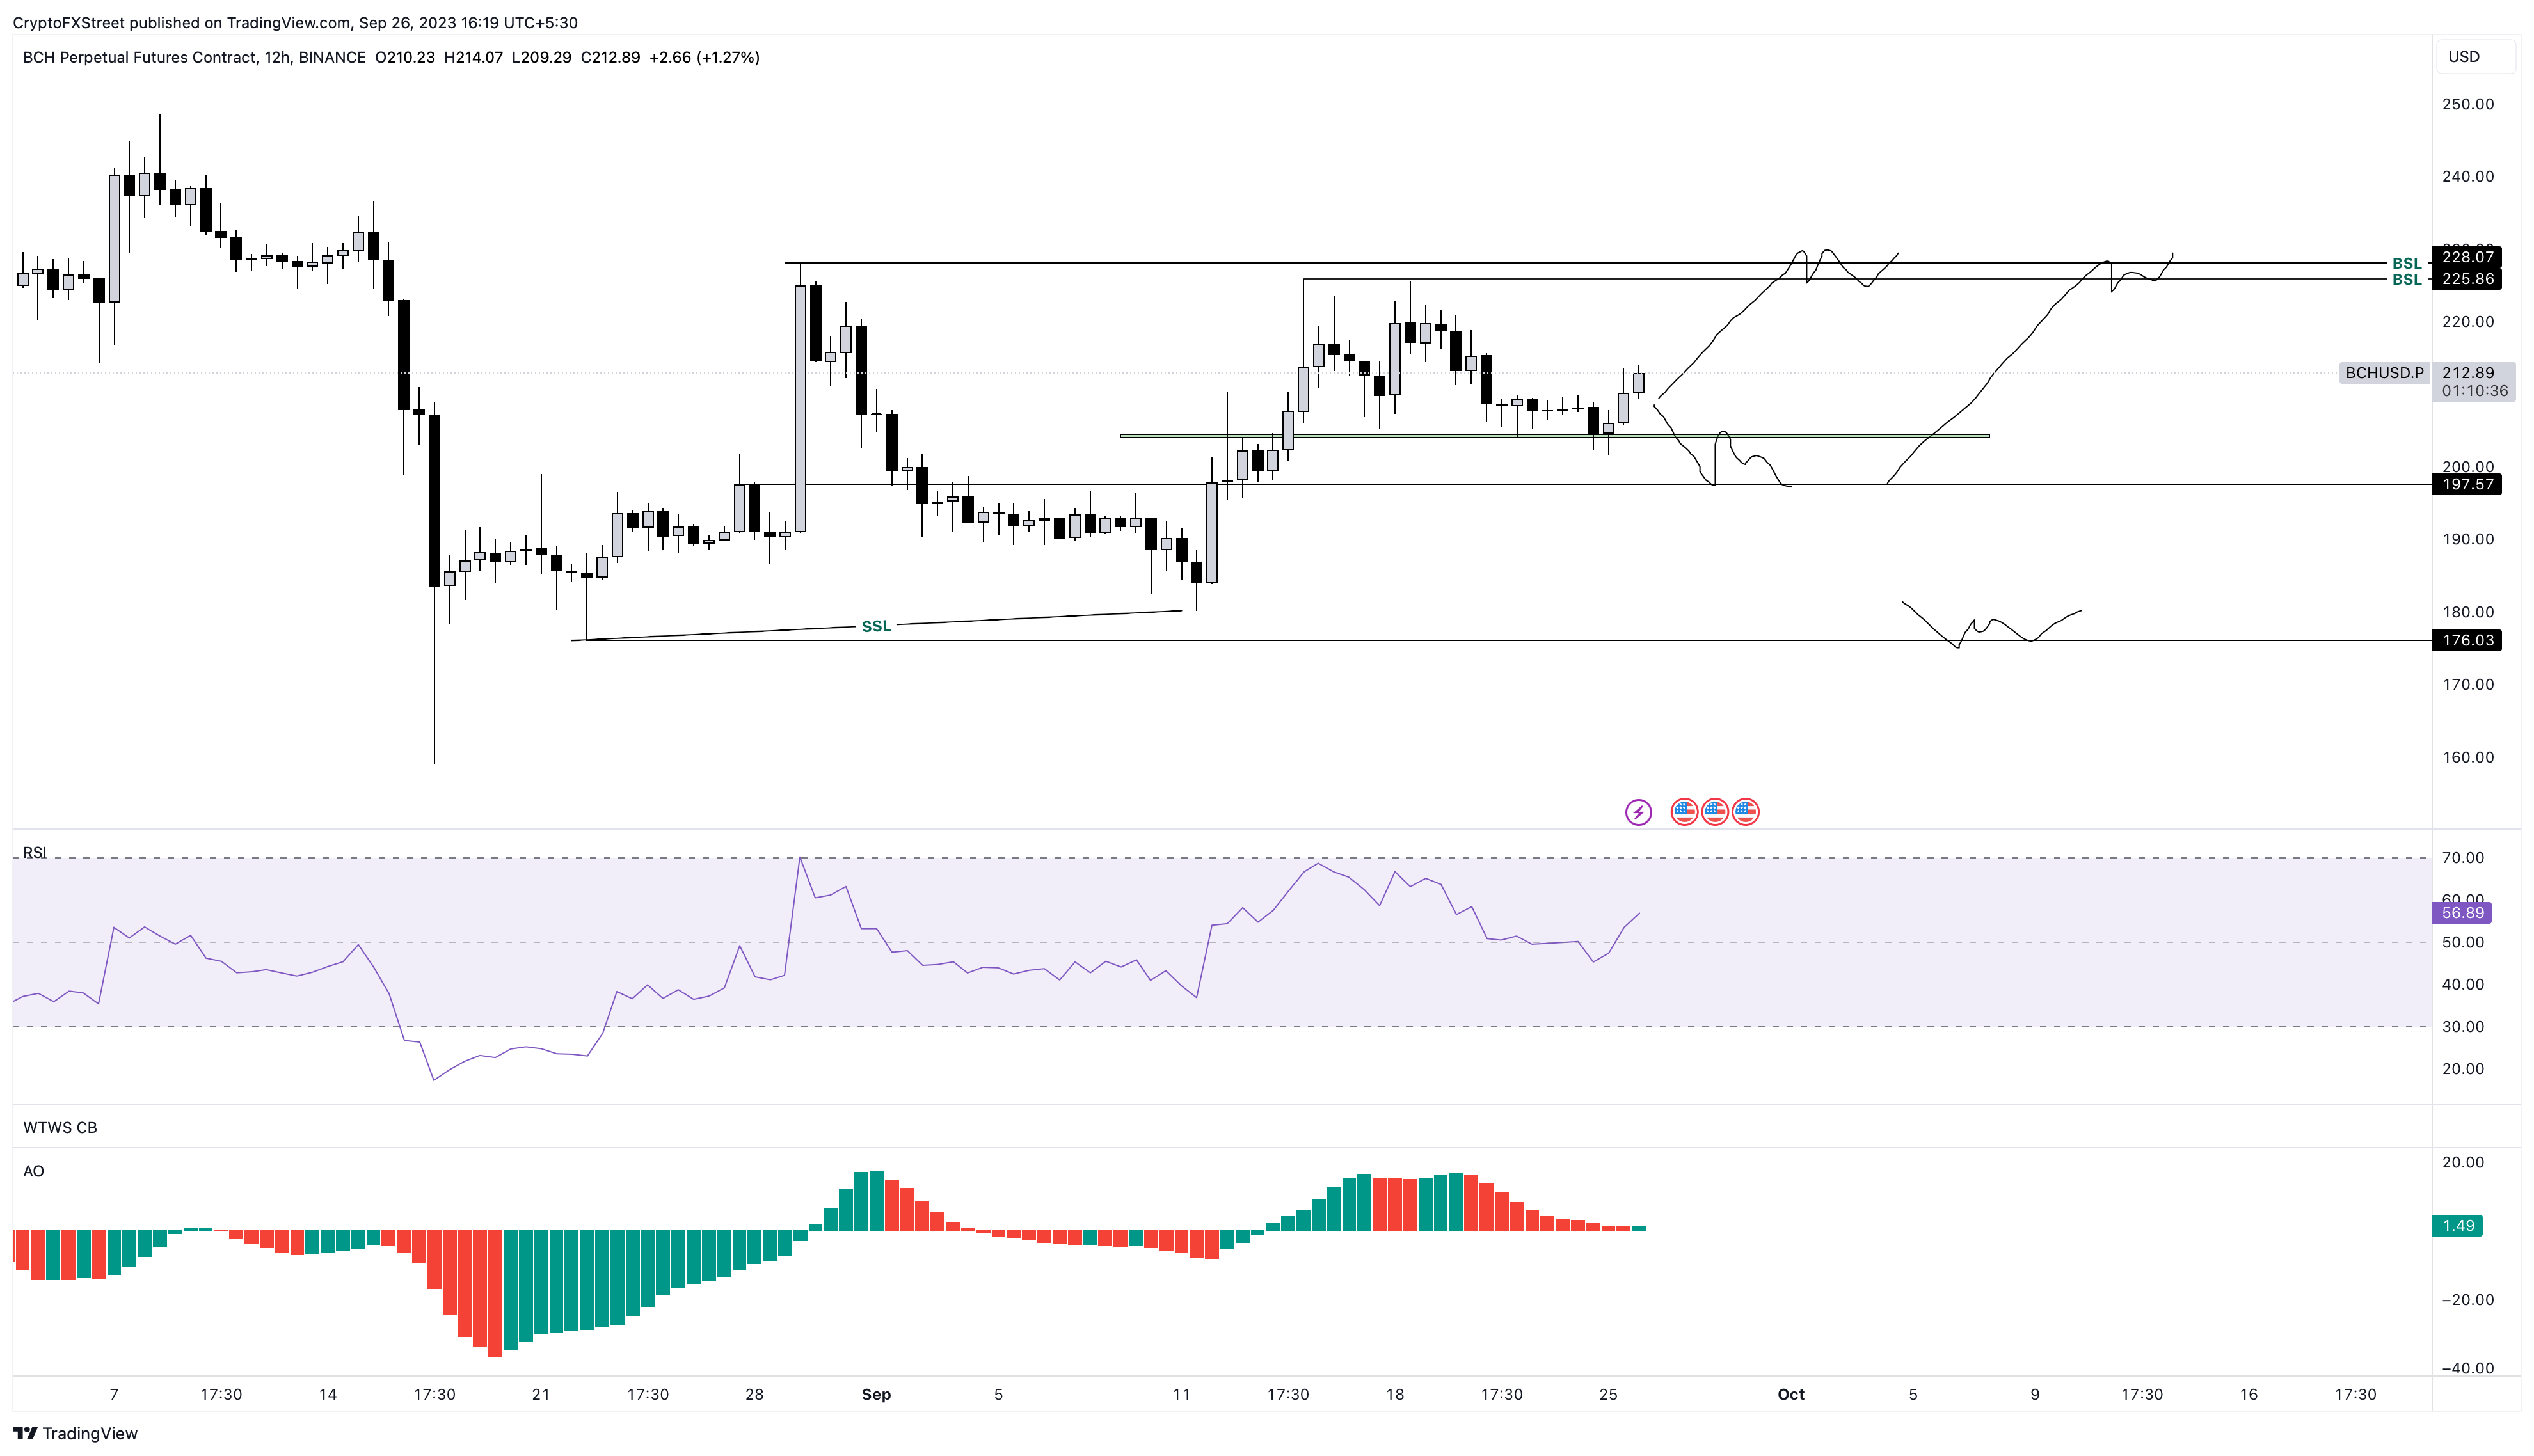
Bitcoin Cash price shows signs of moving higher after creating a local low at $204. This shift in trend could continue until BCH sweeps the $225 and $228 levels, resting above which is buy-side liquidity. 

The main bias of this forked coin is bullish, and interested investors can decide to enter this trade from the current position of $212 or wait for a dip to $197. 

Further supporting this outlook is the Relative Strength Index (RSI), which has flipped above the mean level on the daily. On the 12-hour chart, however, the RSI has recovered above 50 after a brief dip below it. Both of which suggest a bullish resurgence. 

The Awesome Oscillator (AO) is also attempting a reset at the zero level, which adds credence to the bullish outlook. 
Read more: Bitcoin Cash price peeks 15%, liquidates millions in short positions amid Franklin Templeton ETF hype

BCH/USDT 12-hour chart

BCH/USDT 12-hour chart

On the contrary, if Bitcoin Cash price fails to hold above the $197 support level, it will signal a continuation of the downtrend. A decisive daily candlestick close below this barrier would invalidate the bullish thesis by producing a lower low.

Such a development would see Bitcoin Cash price eye the sell-side liquidity resting below $176.

Also read: Binance reopens Belgium operations after three months of suspension by FSMA

Author

Akash Girimath

Akash Girimath is a Mechanical Engineer interested in the chaos of the financial markets. Trying to make sense of this convoluted yet fascinating space, he switched his engineering job to become a crypto reporter and analyst.


More from Akash Girimath
Share:

Editor's Picks

Cardano Price Forecast: ADA extends gains after Mastercard deal, Leios testing

Cardano price extends a steady near-term recovery on Monday, inching closer to the long-term 200-day EMA near $0.2464. The recent partnership with Mastercard and the Leios upgrade testing lift ADA investors' spirits. The technical outlook for ADA shows an upside bias as bullish momentum recovers.

Crypto Overview: Bitcoin reclaims $80,000 – Venice Token and NEAR Protocol rally

Bitcoin is trading above $81,000 holding firm after a 6% surge on Friday, linked to US financial watchdogs' efforts to structure crypto assets under existing rules following the CLARITY Act's failure to advance. Venice and NEAR Protocol have posted double-digit gains over the last 24 hours, scaling to fresh annual highs.

Top 3 Price Prediction: BTC extends gains, ETH and XRP advance in uptrend

Bitcoin, Ethereum, and Ripple extend their gains after posting strong gains of over 5%, 6% and 5%, respectively, last week. BTC trades above $81,300, ETH climbs above $2,600, and XRP holds above the key $1.300 support level. All three momentum indicators suggest early bullish momentum and hint at further gains ahead.

Bitcoin pushes above $81K, faces liquidation test between $83K and $86K
Bitcoin (BTC) rose above $81,000 on Friday after climbing back above the True Market Mean, signaling that the market could potentially have moved back into a bullish regime. The True Market Mean, at $76,660, represents the average price paid by active trading participants. BTC’s move back above the level often signals a return to bullish territory and can trigger positive short-term sentiment.
Bitcoin: BTC shrugs off CLARITY Act setback and hawkish Fed
Bitcoin (BTC) price action has remained resilient this week, trading above $78,000 at the time of writing on Friday, heading toward a key resistance zone. Institutional demand shows early signs of weakness, with spot Exchange Traded Funds (ETFs) on track for a second straight week of outflows, with over $420 million recorded through Thursday amid escalating Middle East tensions.


