Bitcoin Cash Price Forecast: BCH downside capped off at 200-day SMA – Confluence Detector
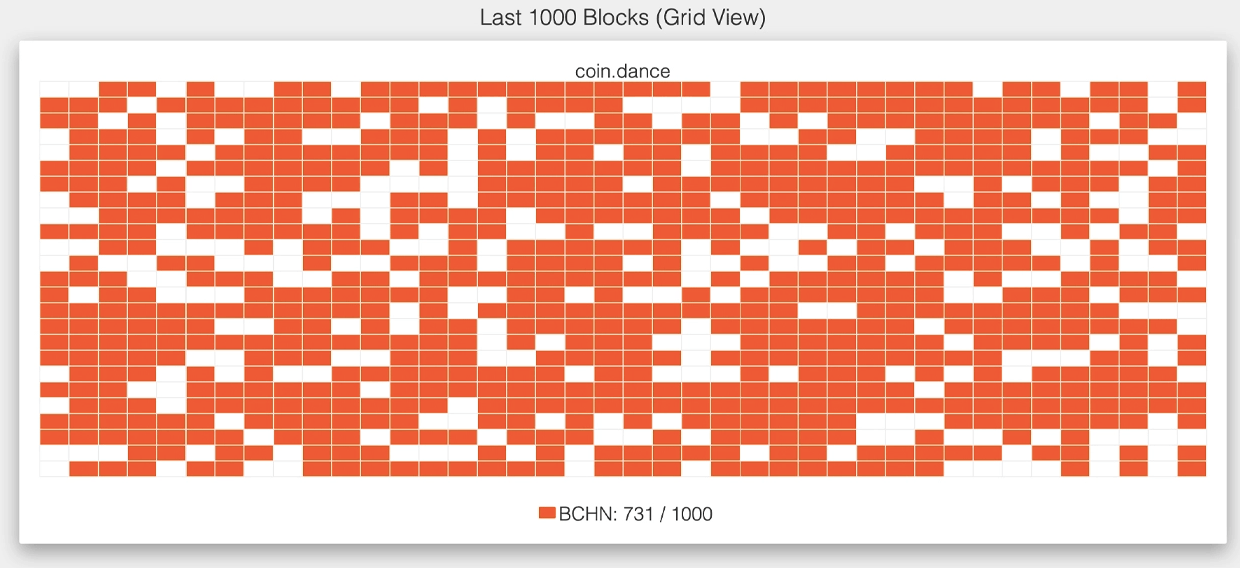
- 731 of the last 1,000 Bitcoin Cash blocks were mined using BCHN.
- The 3-day chart for BCH has flashed a sell signal.

As previously reported by FXStreet, Bitcoin Cash is on the verge of a hard fork as the protocol readies itself to split between BCH ABC and BCHN. As per Coin Dance, it looks like the majority of the miners are heavily favouring the BCHN protocol. It seems like 73% or 731 blocks out of the last 1,000 was mined using BCHN.
BCH bearish swing underway
Bitcoin Cash found support at $240 and rose to $276 between October 21 and October 24. Since then, the price experienced a severe downturn as BCH plummeted to $260, at the time of writing. Further downward movement will probably be inhibited by the 100-day SMA ($256.25), 200-day SMA ($247) and 50-day SMA ($236).
BCH/USD daily chart
-637393648719875193.png)
The daily confluence detector shows that BCH price faces an immediate resistance stack between $261 and $262, which stops any further movement. The strongest support lies at the 200-day SMA ($247). So, even if the price breaks below the 100-day SMA, the downside is capped at $247.
BCH daily confluence detector

The 3-day chart adds further credence to our bearish outlook. BCH/USD has flashed a sell signal in the TD sequential indicator, with a green-nine candlestick. In this time frame, the downside target is located at the 50-SMA bar ($250).
BCH/USD 3-day chart
-637393649423684422.png)
The Flipside: Do the bulls have any hope?
The encouraging sign for BCH investors should be the fact that whales seem to be religiously buying the dump. The number of addresses holding 10,000-100,000 tokens rose from 164 on October 25 to 168 on October 27. While this jump may not seem that significant, keep in mind that these addresses are holding hundreds of thousands to millions of dollars worth of BCH.
BCH holders distribution
 [07.24.11, 27 Oct, 2020]-637393650077815124.png)
Key price levels to watch
The bears will attempt to push BCH down to the 200-day SMA ($247), which provides strong enough support to prevent any further downturn.
For the buyers, they will need to flip the $261-$262 resistance barrier to support. Following that, they will be able to take the price up to $275.
Author

Rajarshi Mitra
Independent Analyst
Rajarshi entered the blockchain space in 2016. He is a blockchain researcher who has worked for Blockgeeks and has done research work for several ICOs. He gets regularly invited to give talks on the blockchain technology and cryptocurrencies.



