Bitcoin bull market is still going strong, on-chain data shows
- Bitcoin’s price outlook remains robust as long-term holders' selling pressure eases.
- Institutional investors bought Bitcoin during local price bottoms at roughly $57,500.
- The Market Value to Realized Value indicator suggests further upside ahead.

Bitcoin’s (BTC) price outlook remains positive in the short term despite its recent stabilization, on-chain data suggests, propelled by easing selling pressure by long-term holders and activity from large-wallet investors.
Bitcoin whales analysis indicates bullish sentiment
Bitcoin’s price reached $71,979 on May 21, nearly matching its all-time high (ATH) of $73,777, but it retreated slightly amid choppy trading. An analysis of the behavior of large-wallet investors, popularly known as whales, provides a picture of where Bitcoin’s price might head in the short term.
Santiment data about Bitcoin and the top stablecoins provides some clues about whales. Each of these three lines in the graph below indicates an important aspect of how well Bitcoin and the rest of the cryptocurrency market are positioned for future price increases:
%20[15.37.11,%2029%20May,%202024]-638525843931414760.png)
Bitcoin and top Stablecoin chart
- The bright red line, which represents the percentage of BTC held by wallets with 10 to 10,000 BTC, has declined by 0.76% in the last two months.
- The dark yellow line, which shows the total collective BTC owned by wallets with 10 to 10,000 BTC, has decreased by 0.38% over the last two months.
- The blue line, representing the percentage of stablecoin total supply held by whales with more than $5 million, has increased 5.49% over the last two months.
Two of the three lines are going downward (historically, these lines have led to Bitcoin price corrections), indicating that a BTC correction is likely. Still, large investors are increasing their holdings in stablecoin, implying more buying power in the event of any dips.
Santiment data of Whale Transaction Count greater than $100,000 for BTC daily transfers show that whale activity has declined for the last three months, apart from when BTC reached its ATH on March 14. This suggests that large stakeholders are not finding any opportunities to take a profit or accumulate right now.
%20[10.17.36,%2028%20May,%202024]-638525846912258215.png)
BTC Whale Transaction Count (>100k USD) chart
While studying the Whale Transaction Count greater than $1 million for BTC daily transfers, it also looks the same: whale activity has declined for the last three months. The only difference is that on May 20, there was a spike in the daily transfer when the price was running toward its ATH, signaling that profits were booked and waving a price top.
%20[10.21.37,%2028%20May,%202024]-638525848541738103.png)
BTC Whale Transaction Count (>1m USD) chart
When we compare Bitcoin Bull Market Correction Drawdowns data from Glassnode, we can see that the drawdown pattern spanning the 2023-2024 uptrend is strikingly similar to the 2015-2017 bull market.
However, before the 2015-2017 bull trend began, Bitcoin had no derivative instruments accessible, as opposed to now, when Bitcoin ETFs are available.
-638525849818359184.png)
BTC Bull Market Correction Drawdowns chart
According to Glassnode Bitcoin ETF Flows & Insurance Exchange Netflow (7-day Moving Average), the ETFs had significant net inflow peaks of $353 and $431 million per day in February and March, respectively. As Bitcoin price fell to a low of roughly $57,500, the ETFs experienced a significant net outflow peak of $148 million per day. This move served as a form of micro-capitulation, and this tendency has reversed significantly.
Last week, we observed a spectacular net inflow of $242 million per day, indicating a resurgence of buy-side interest.
Since miners' natural daily sell pressure has been $32 million per day since the halving, the ETFs' buying pressure is nearly eight times more. This implies that increasing demand and decreasing insurance for BTC would positively affect its price.
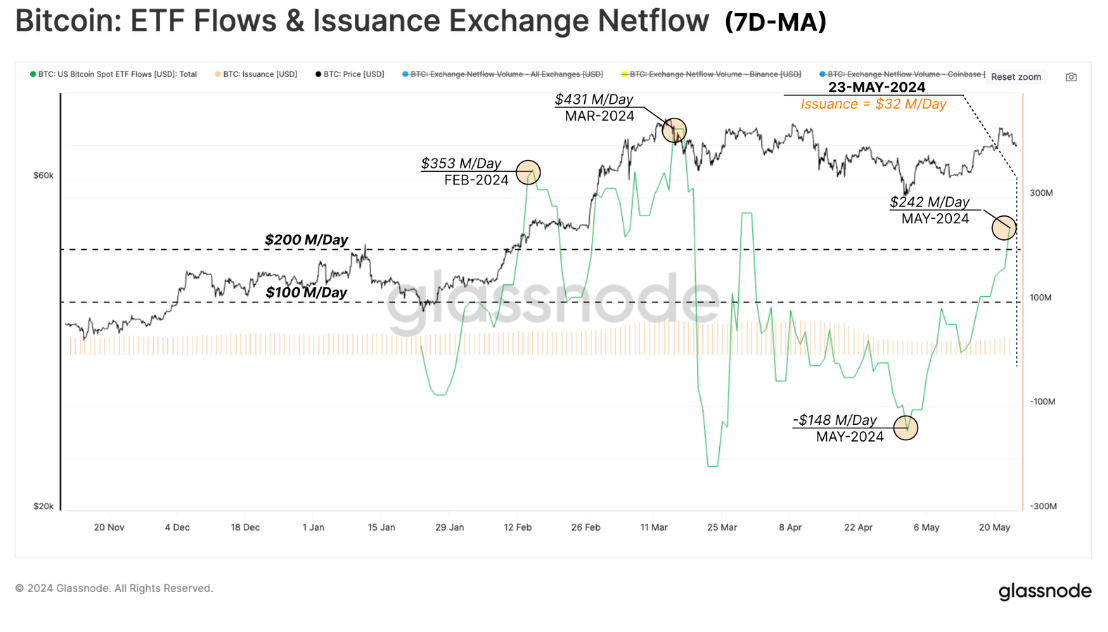
BTC ETF Flows & Issuance Exchange Netflow (7-day MA) chart
Refer to Cryptoquant's Market Value to Realized Value (MVRV) indicator, which shows if the Bitcoin price is overpriced or undervalued and could determine the peak and bottom of the bull and bear markets.
As witnessed in the 2019 and 2022 bear markets, the MVRV fell to 0.69 and 0.74, respectively, and signaled that the Bitcoin price was undervalued and had achieved its bear market bottom.
Similarly, during the 2018 and 2021 bull markets, the value of MVRV peaked at 4.83 and 3.97, respectively, indicating that the Bitcoin price was overvalued and the market had achieved its bull market top.
The MVRV is currently hovering at 2.74 and has not reached the overvalued zone, indicating that bulls still have room to rally the Bitcoin price.
-638525852520056763.png)
BTC MVRV Ratio chart
As previously noted, MVRV statistics, positive ETF inflows, and increased stablecoin ownership, all point to Bitcoin bulls being strong enough to drive the price higher in the ongoing bull market.
Author

Manish Chhetri
FXStreet
Manish Chhetri is a crypto specialist with over four years of experience in the cryptocurrency industry.


![Hyperliquid representatives, Trade[XYZ] meet SEC Crypto Task Force to discuss digital asset regulation](https://editorial.fxsstatic.com/images/i/Hyperliquid_Bull.png)
