Binance Coin Price Prediction: BNB eyes $600, may overshoot to $700
- Binance Coin price shows a slump in bullish momentum after a 15% upswing.
- A minor pullback to $520 or below could provide buyers an opportunity to refuel.
- The supply zone that ranges from $569 to $603 is the only thing keeping BNB from entering price discovery mode.
Binance Coin price shows a slowdown in its buying pressure as it pierces a crucial resistance barrier. Investors can expect BNB to retrace to immediate support levels before surging higher.
Binance Coin price may slide lower before hitting record levels
Binance Coin price shows signs of exhaustion as the Momentum Reversal Indicator (MRI) flashed a cycle top signal in the form of a red ‘one’ candlestick on the 6-hour chart. This setup forecasts a one-to-four candlestick correction.
Interestingly, the timing of the MRI’s sell sign coincides with the exchange token piercing the supply barrier's lower boundary at $569, confirming a correction soon. The pullback could extend anywhere between 4% to the bottom of the demand zone at $494.
This retracement will allow buyers to scoop up BNB at a discount for the next leg that aims to tap the swing high at $639.
If Binance Coin price produces a decisive close above this level, the discovery phase could allow market participants to propel it to the 162% Fibonacci extension level at $719.
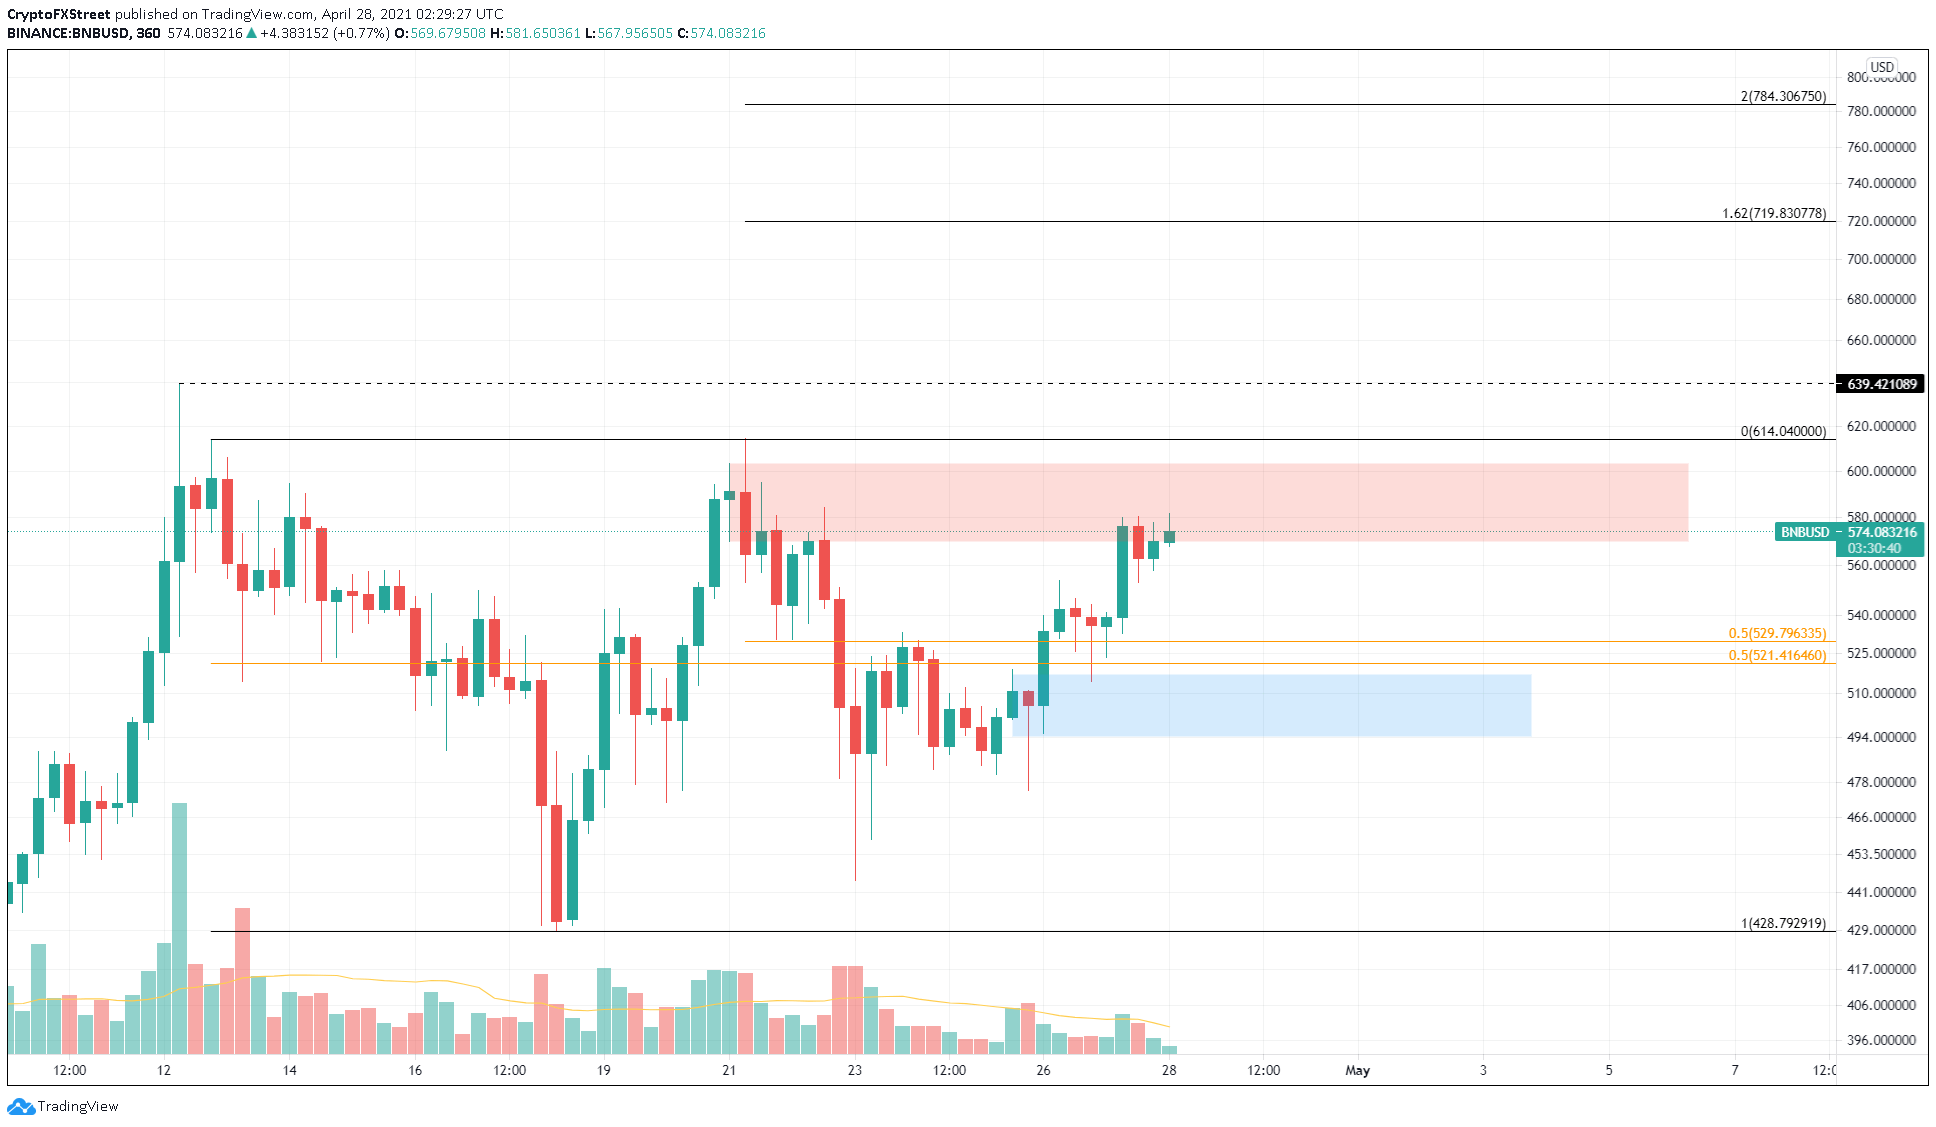
BNB/USDT 6-hour chart
Supporting this retracement and spike to recent highs is the 30-day MVRV model by Santiment, which tracks the average profit/loss of investors who purchased BNB over the past month.
Currently, the fundamental index is at 6.67%, but historical data reveals that a local top could occur around 21%. This indicates that Binance Coin price has room to grow.
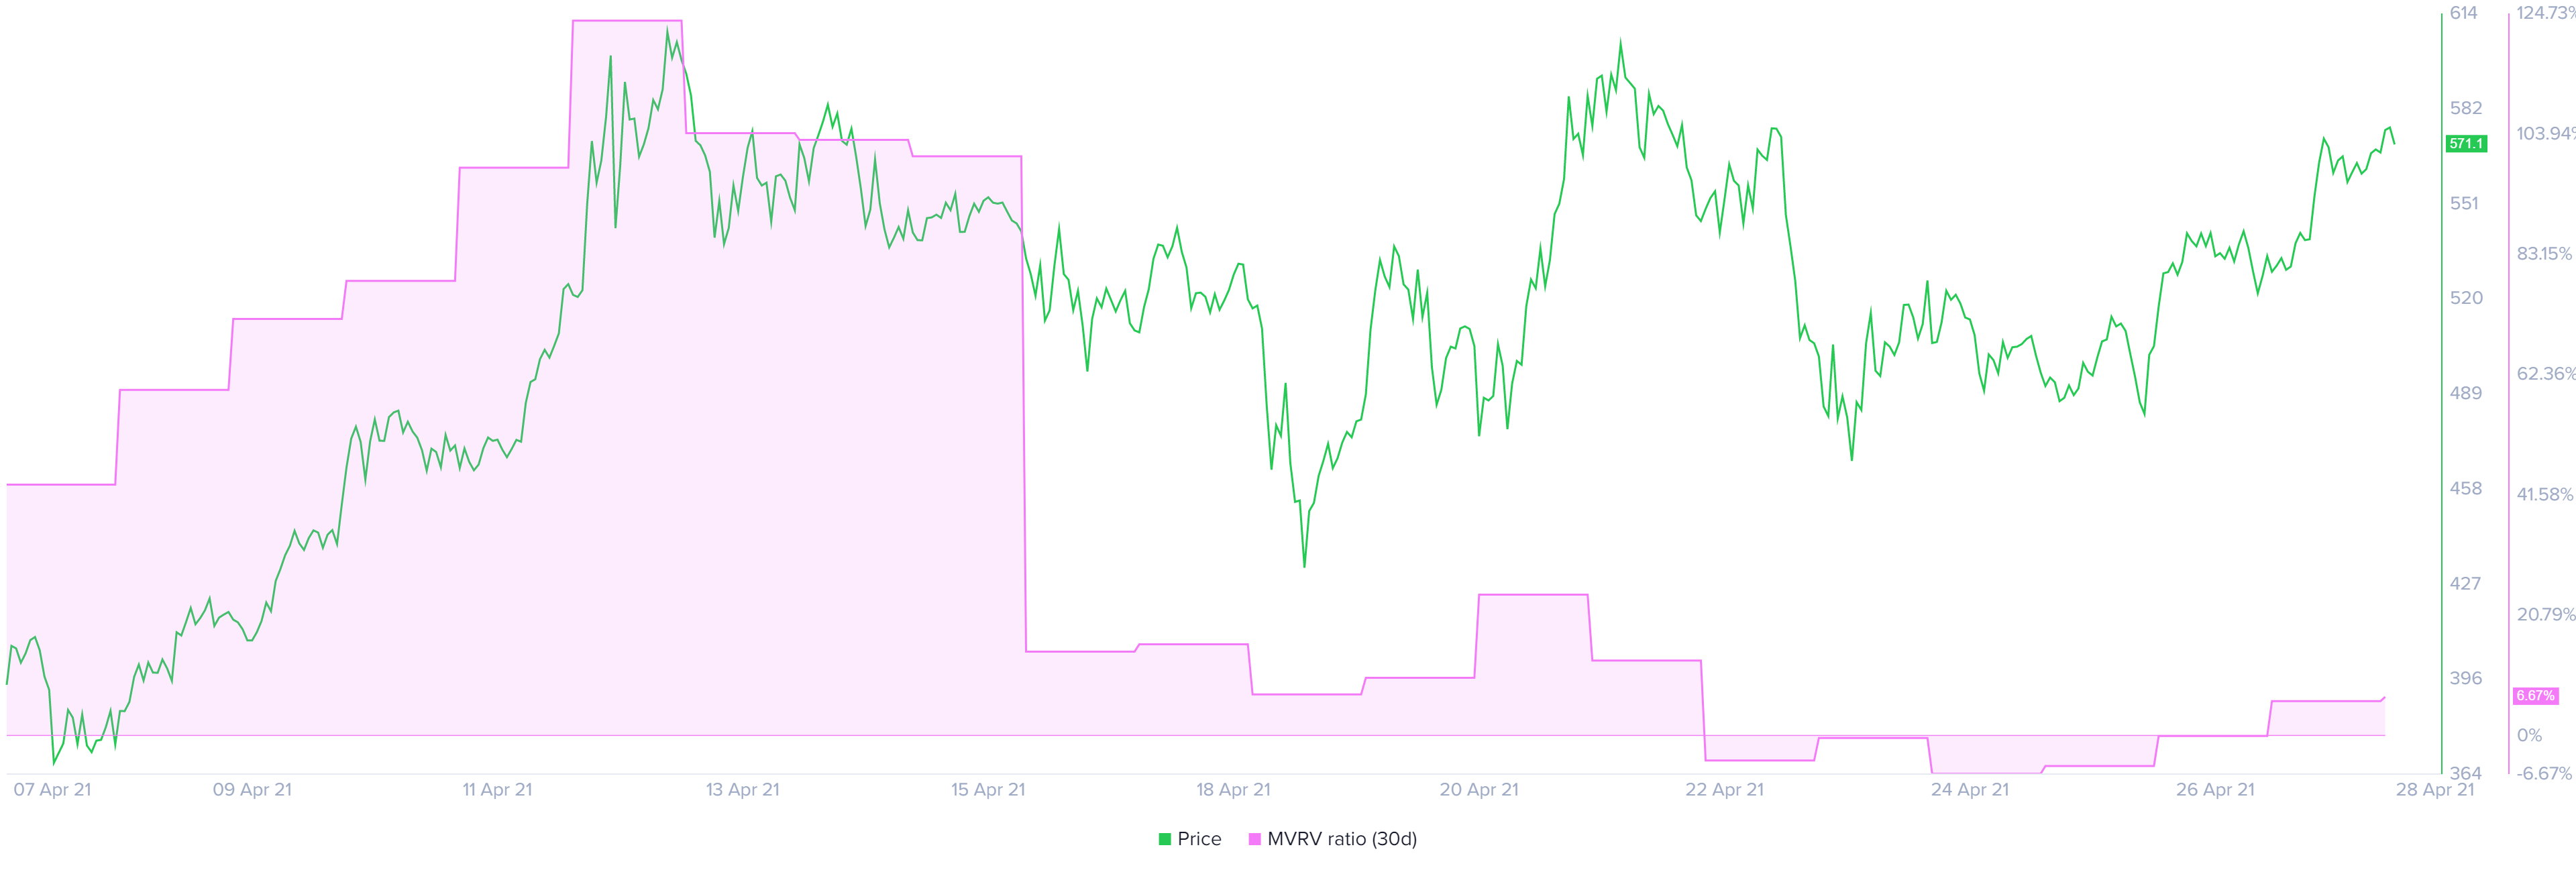
BNB 30-day MVRV chart
Daily Active Addresses is a metric that can be used to determine the state of investors. A higher number indicates a bullish bias since more users are interacting with the BNB network and are interested in it at the current price levels.
At the time of writing, this indicator has declined 58% from 313,000 on 130,000 addresses between April 20 and April 27. This sudden slump paints a bearish picture, suggesting that investors are fleeing the network via reallocation of funds or profit-taking.
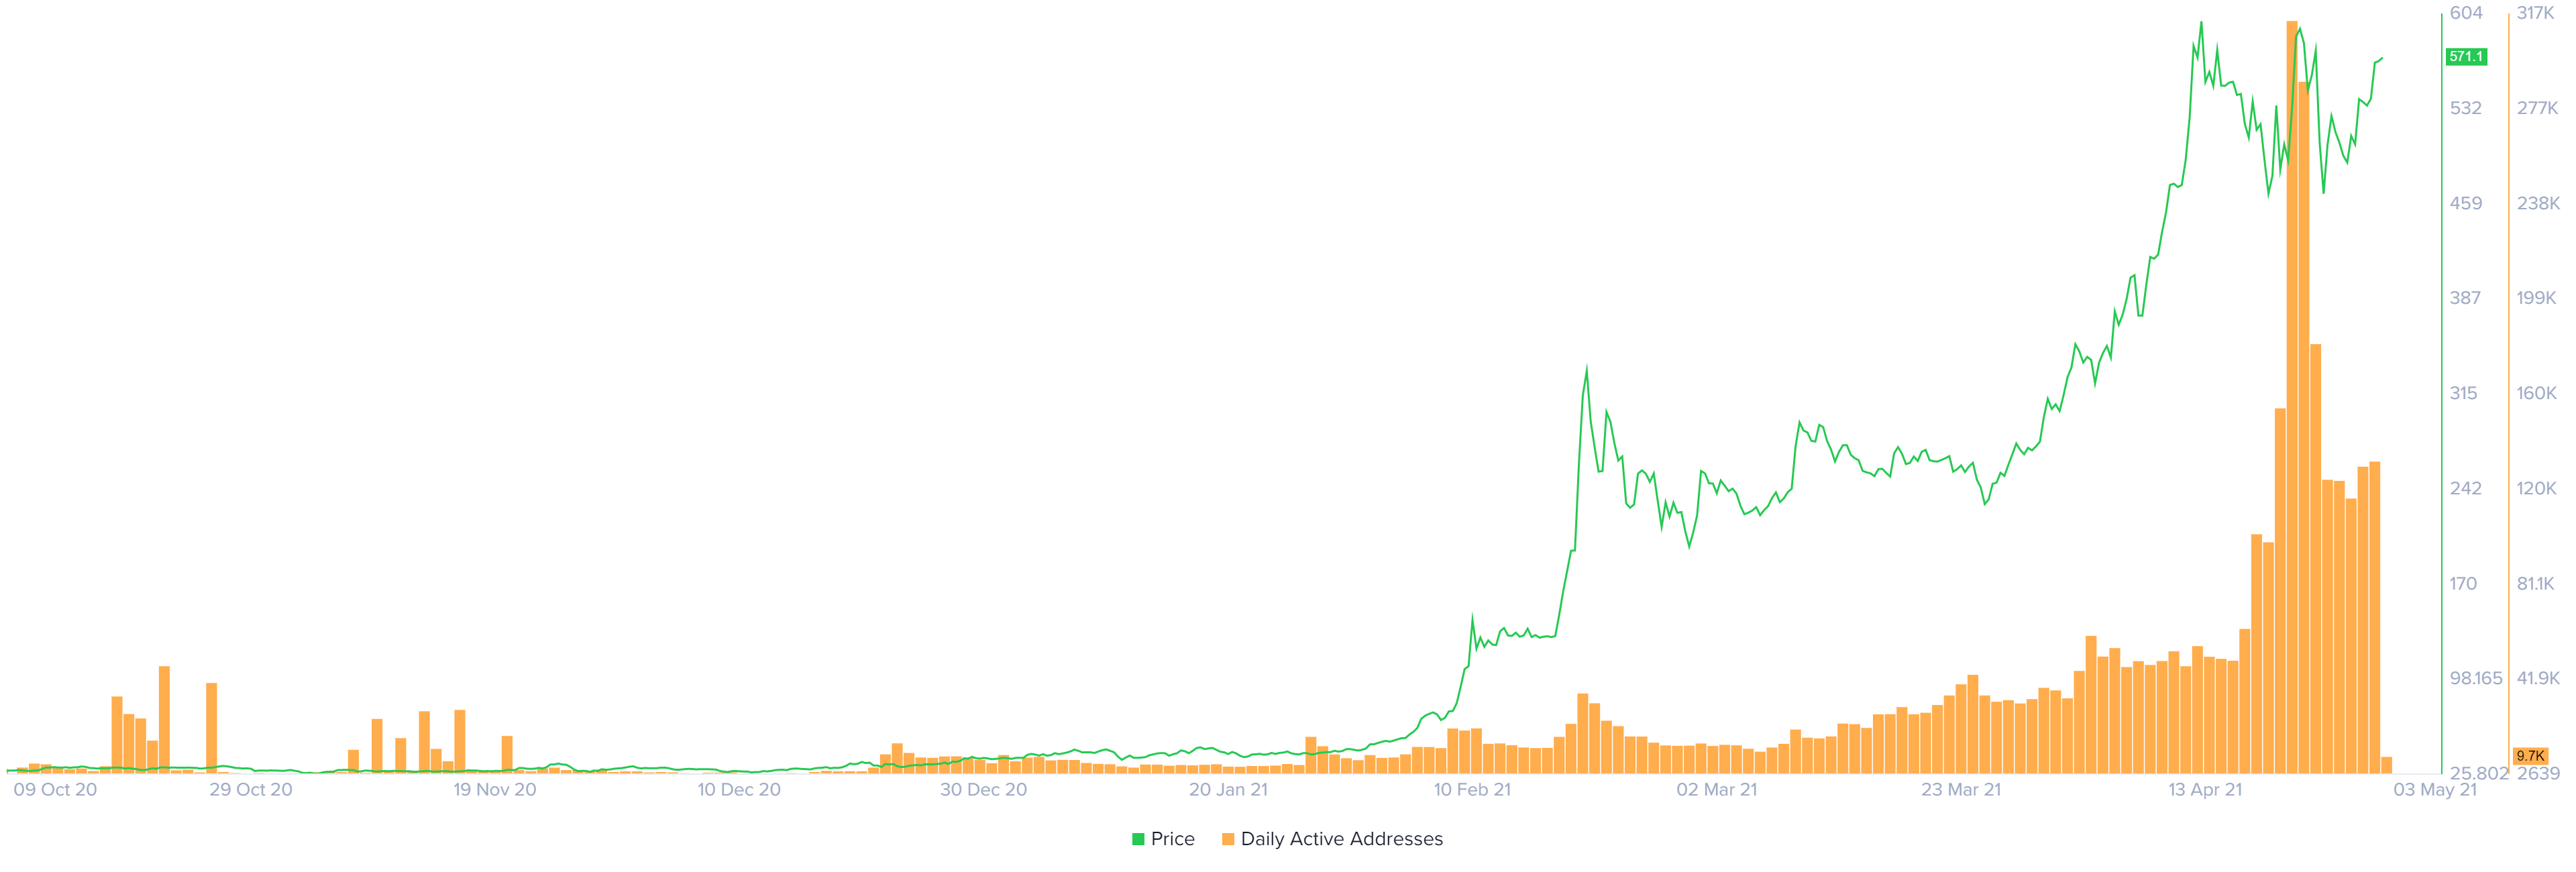
BNB daily active addresses chart
While a minor retracement seems likely, investors need to pay attention to the extent of the pullback. If Binance Coin price slides $472, it will invalidate the bullish scenario and might extend the correction up to $444.
Author

Akash Girimath
FXStreet
Akash Girimath is a Mechanical Engineer interested in the chaos of the financial markets. Trying to make sense of this convoluted yet fascinating space, he switched his engineering job to become a crypto reporter and analyst.


