Binance Coin price starts its engines, targeting a 30% advance as the number of tokenized stocks grow
- Binance Coin price quietly shaping a symmetrical triangle pattern in April.
- BNB on pace to close with the fourth-best monthly return since July 2017.
- Microsoft, Apple, and Microstrategy to be listed on Binance as tokenized stocks.

Binance Coin price has withstood the heavy selling in the cryptocurrency market in April and illustrates a symmetrical triangle pattern on the intra-day charts. As a continuation pattern, speculators can anticipate a new high in the coming days.
Binance Coin price so close to shining again
As a general rule, the higher the MVRV ratio (30d), the greater the unclaimed profits. In turn, the higher the risk results with BNB speculators beginning to sell or reduce their exposure. Thus, a high MVRV ratio is associated with overbought conditions, while a negative MVRV ratio is often a timely point to consider accumulating the token. As a percentage, an MVRV over 20% is viewed as the threshold for being overbought.
On April 23-24, the MVRV ratio (30d) hit a low of -6.6%, signaling an oversold condition in the market. The oversold reading is slightly above the March 24-25 reading of -7.33%, which corresponds to the beginning of the 170% rally into the April 11 high.
The ratio has modestly improved but still signals that many speculators hold losing positions and are unlikely to sell, presenting a high probability opportunity.
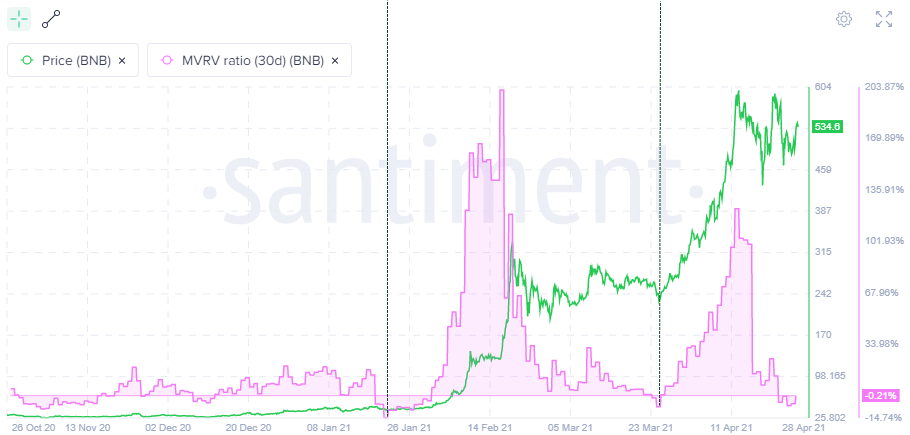
BNB MVRV ratio (30d)
April has been an exciting month for the cryptocurrency market, marked by a couple of large downswings, carrying some tokens down over 50% from the highs. BNB also declined, but on a relative basis, it has been a leader. Moreover, a glance at the statistics shows an entirely different picture than bearish commentary that has blanketed mainstream and social media.
Binance Coin price is currently up over 75% in April, making it the fourth-best monthly return since July 2017 and the sixth consecutive positive month. Additionally, it closed last week with a gain of over 4%. Definitely, not the numbers of an altcoin in distress.
As mentioned above, Binance Coin price has been quietly illustrating a symmetrical triangle pattern on the 12-hour chart with a measured move target of 33% or $794.95 from the current position of the triangle’s upper trendline.
The April 20 high of $614.63 is the first point of resistance, followed by the April 11 high at $639.42. If the measured move target is easily overcome, speculators should turn to the 161.8% Fibonacci extension of the April decline at $818.53 and then the 261.8% extension of the February crash.
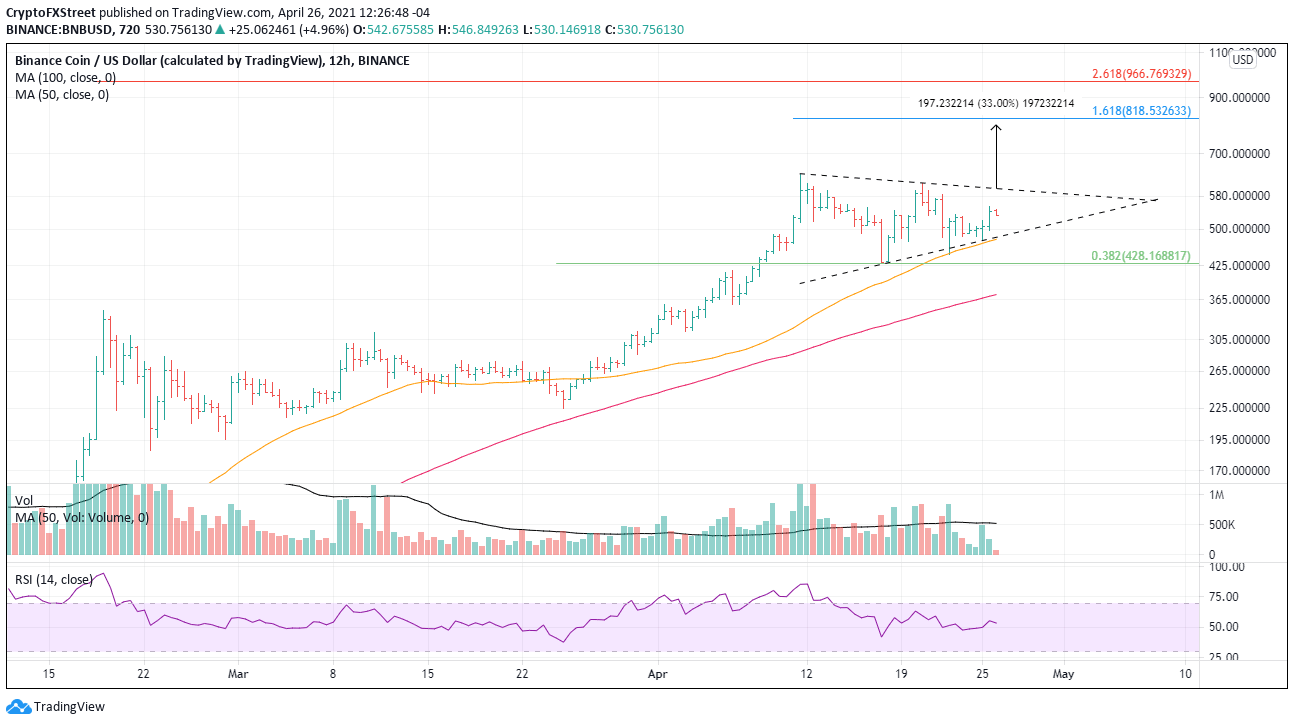
BNB/USD 12-hour chart
In April, the market conditions have demonstrated that participants need to be prepared for everything, thus making risk management preparations equally important. Critical support is at the intersection of the triangle’s lower trend line at $482.45 and the 50 twelve-hour simple moving average at $478.05. Additional support levels emerge at the crossroads of the April 17 low at $428.79 and the 38.2% retracement of the rally since late March at $428.16.
Author

Sheldon McIntyre, CMT
Independent Analyst
Sheldon has 24 years of investment experience holding various positions in companies based in the United States and Chile. His core competencies include BRIC and G-10 equity markets, swing and position trading and technical analysis.



