XRP Price Prediction: Bearish technicals, on-chain indicators signal 68% potential crash
- XRP faces increasing bearish sentiment from macro, micro and fundamental factors in April.
- Weak on-chain indicators ranging from network growth, total supply and active addresses reinforce an impending crash.
- A descending triangle pattern puts $2 support in focus as global markets battle Donald Trump’s tariff uncertainty.
- XRP could rebound from the 200-day EMA, increasing the chances of reclaiming the mid-term $2.5 target.

Ripple (XRP) price slightly recovers and trades near $2.04 at the time of writing on Thursday after a 5.38% decline the previous day as investors across global markets digest US President Donald Trump’s sweeping reciprocal tariffs. Although the ‘Liberation Day’ tariffs appear largely priced in, major digital assets like Bitcoin (BTC), Ethereum (ETH) and XRP struggle to sustain key support levels. Weak on-chain metrics coupled with growing uncertainty at the global stage could cause XRP to slide lower, below the $2 support, not to mention a glaring 68% crash to $0.62.
Trump’s ‘Liberation Day’ tariffs trigger $19M in liquidations
XRP extended the correction, testing $2 support on Thursday while causing $3.94 million in long and short liquidations in the last 24 hours, per Coinglass data. A total of $2.94 million in long positions was forcibly closed in addition to $993k in shorts.
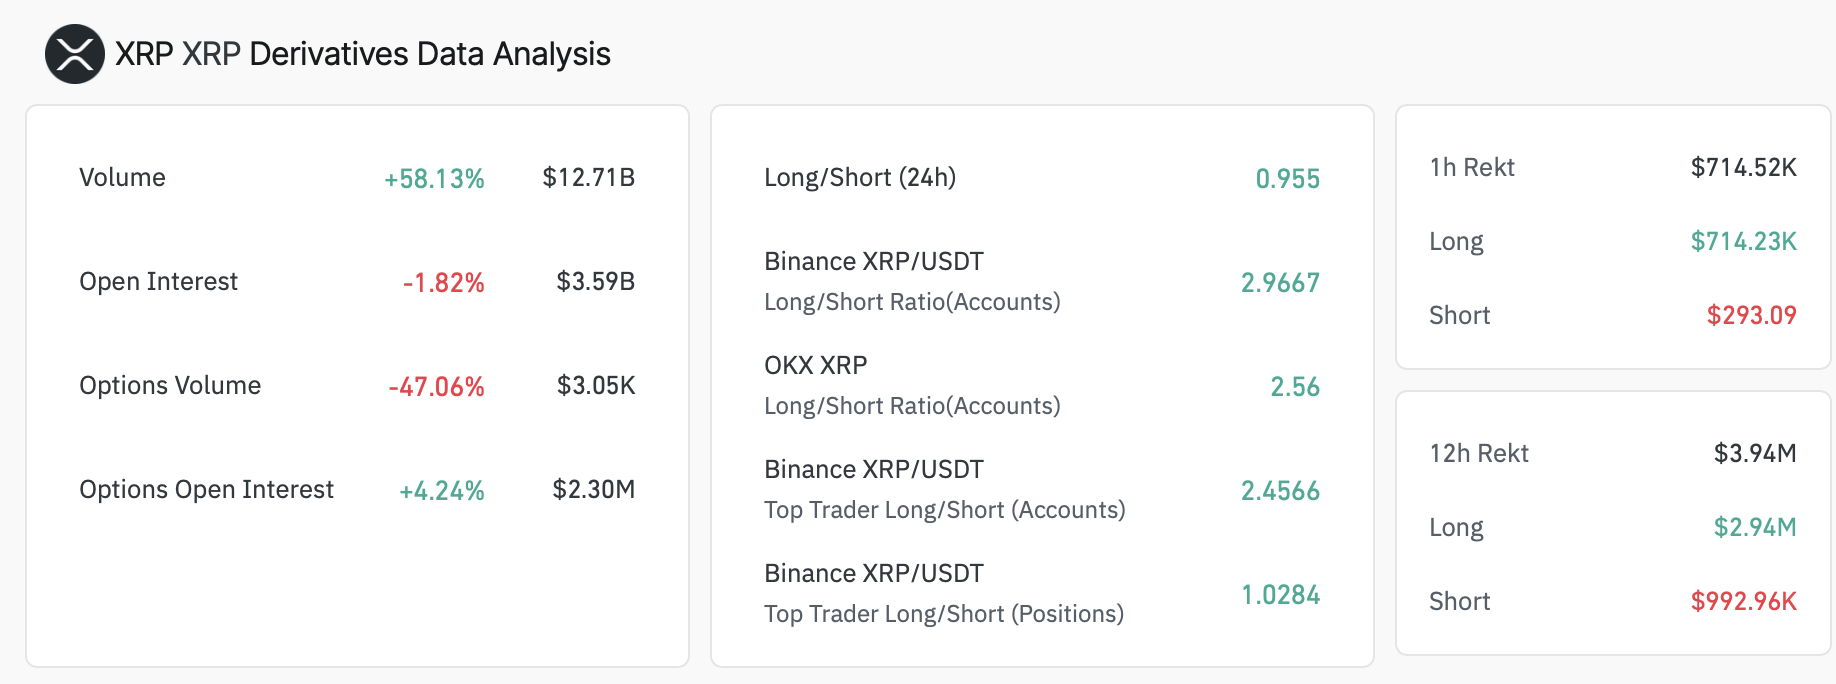
Trump’s sweeping reciprocal tariffs start at a 10% baseline charged on every country exporting goods to the US. However, individual countries like China, India and the European Union will pay half the intended reciprocal tariffs.
“We will charge them approximately half of what they are and have been charging us, so the tariffs will be not a full reciprocal,” Trump said on Wednesday. “I could have done that, I guess, but it would have been tough for a lot of countries, and we didn’t want to do that.”
The cryptocurrency market responded by slashing 3% in value to $2.77 trillion amid widespread single-digit declines. All the top ten coins except stablecoins USDT and USDC are in the red.
Weak on-chain indicators plague XRP
The XRP rally in Q4 2024 and Q1 2025 surpassed 500%, touching $3.4. The upswing piggybacked on several factors, including the run-up to the US elections in November 2024 and the inauguration on January 20, 2025, which paved the way for a crypto-friendly regime. Moreover, the Securities and Exchange Commission (SEC) dropped the four-year case against Ripple in March.
Despite Trump’s commitment to restoring faith in regulatory institutions, which had long ropped the industry in long court battles, the trade war started by the US continues to limit its positive impact.
Santiment’s Network Growth metric sustains a downward trend, reaching 42 on Thursday from 514 addresses in February, as shown in the chart below. This marks another wave of negative sentiment on the cross-border payments token. As an indicator of user adoption, the Network Growth metric tracks the number of new blockchain addresses joining the protocol.
%20[10.31.49,%2003%20Apr,%202025]-638792743206611783.png)
Network growth metric
Similarly, the number of active addresses in the last 30 days declined from a peak of 10,200 in January to the current 4,388. A sustained decrease in the number of addresses actively transacting on the network suggests a risk-off sentiment, hence the subsequent drop in XRP price.
%20[10.31.33,%2003%20Apr,%202025]-638792743794705894.png)
Active addresses chart
The significant increase in the total supply of XRP, per Santiment on-chain data, can be interpreted as a key pain point, reducing the chances of recovery. Ripple has consistently been questioned about its monthly release of new tokens from the escrow account, an operation some people call dumping. As observed in the chart, as supply soars, XRP value declines.
%20[10.31.38,%2003%20Apr,%202025]-638792744280185044.png)
Total supply metric
XRP on the cusp of a 68% drop
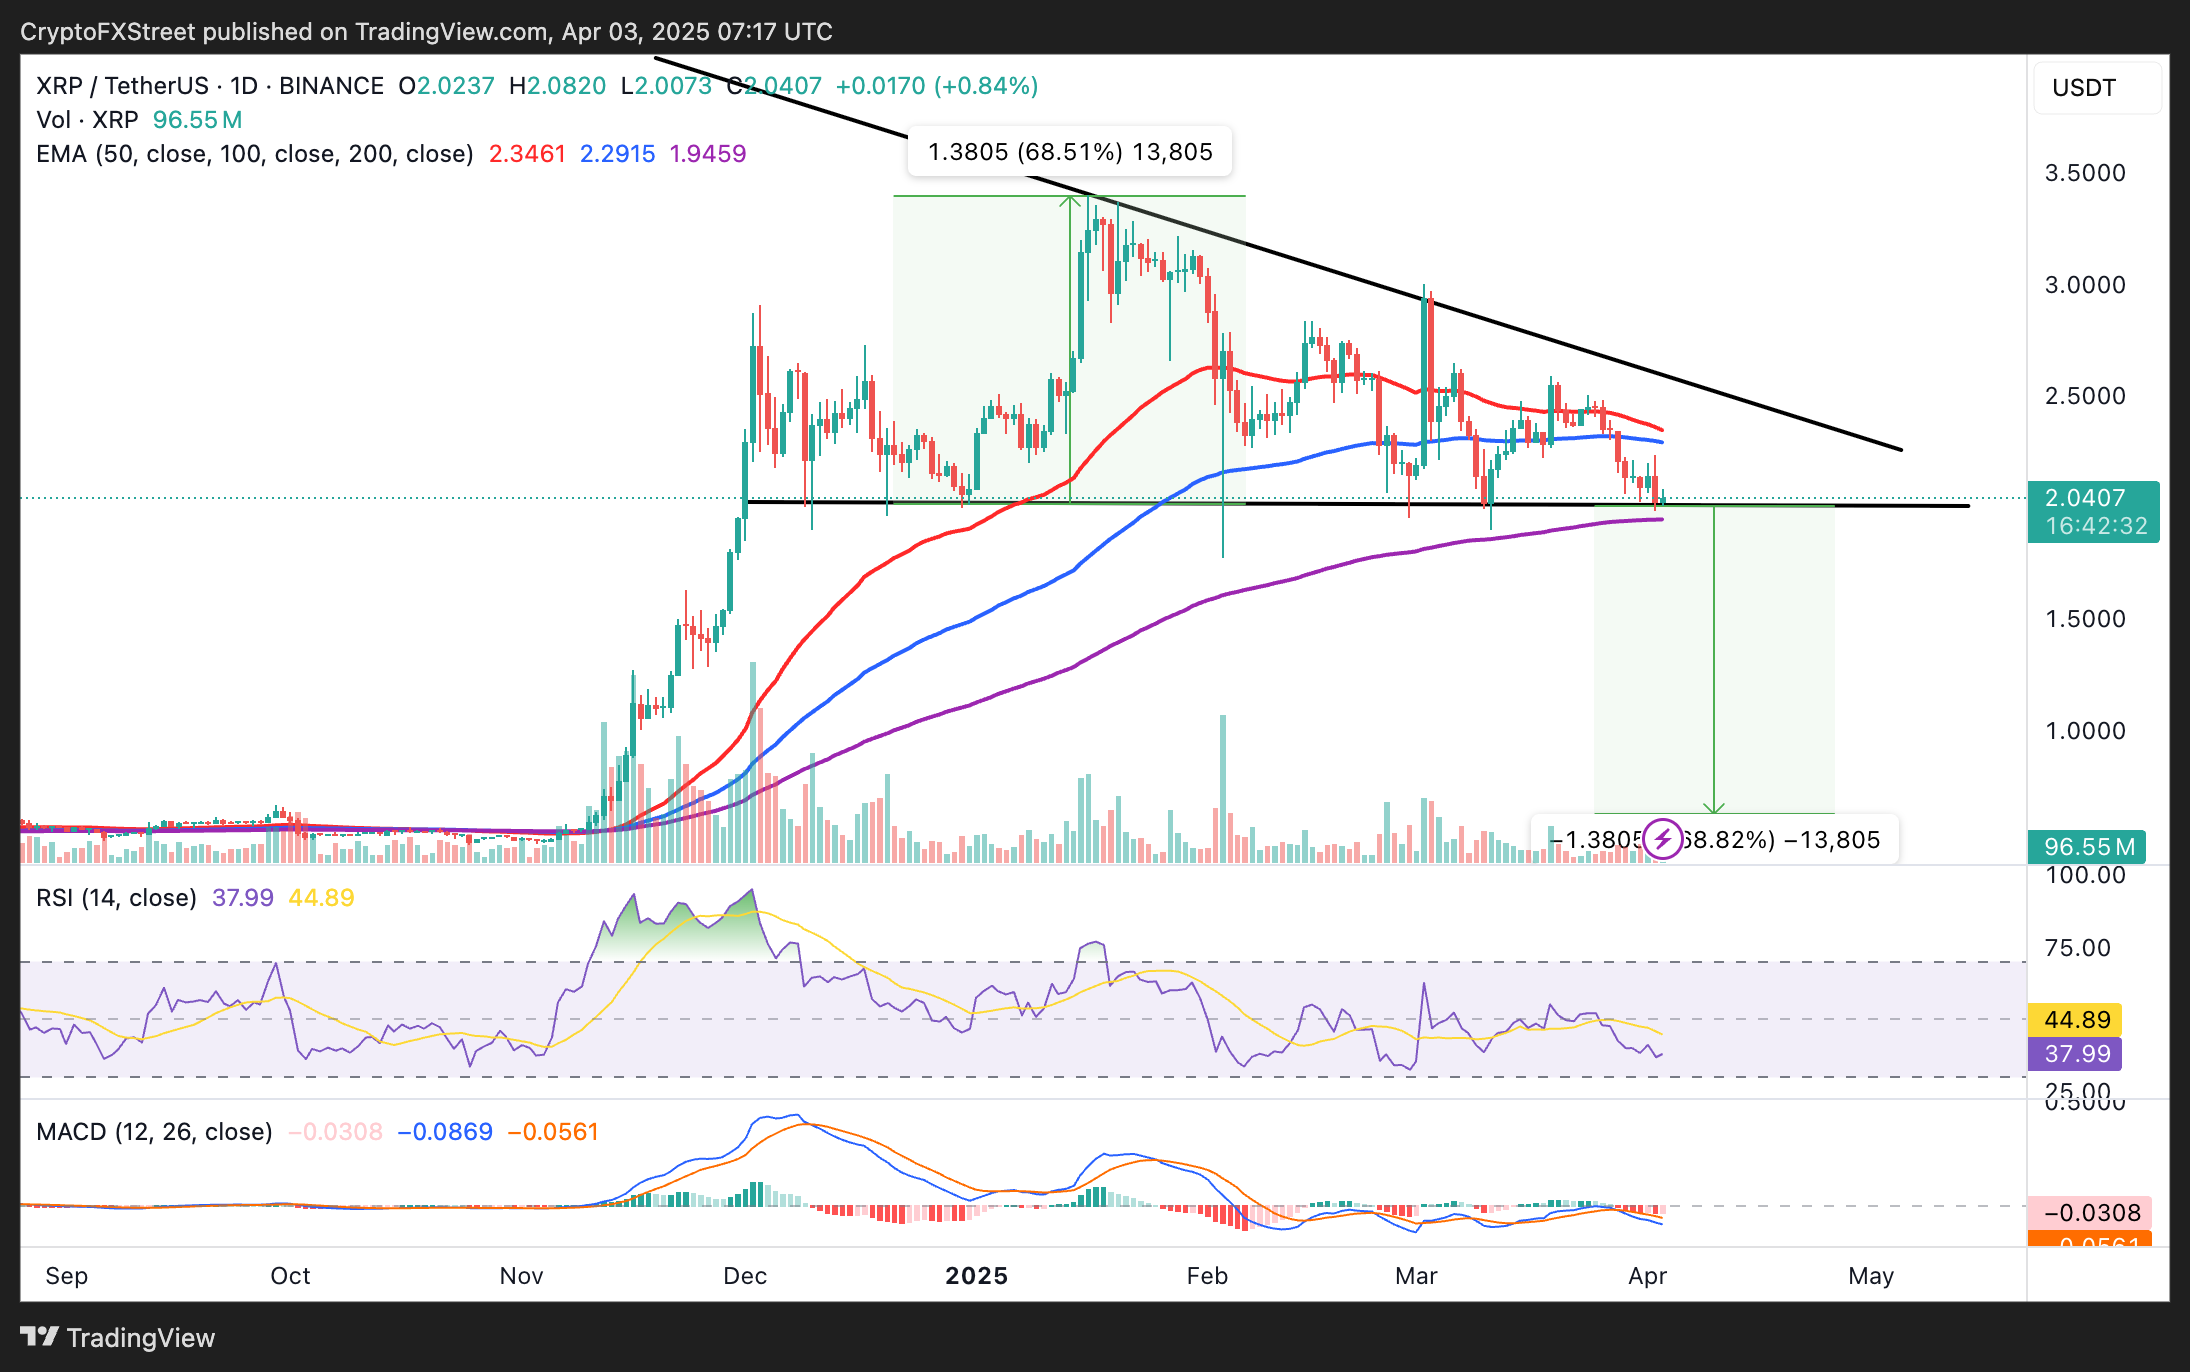
XRP is retesting $2 support amid persistent sell-off from traders seeking to reduce exposure to crypto assets amid rising global trade uncertainty as Trump enacts reciprocal tariffs. Importantly, a descending triangle on the daily chart signals a potential 68% drop to $0.62 if the immediate $2 support level breaks.
Technical indicators such as the Moving Average Convergence Divergence (MACD) and the Relative Strength Index (RSI) highlight a stronger bearish grip on XRP. The RSI at 38 could sweep into the oversold region, while a bearish divergence in the MACD encourages traders to favor short positions over long positions.
XRP/USDT daily chart
Traders must watch the 200-day support at $1.93, which could invalidate the downtrend and set XRP on a new recovery path. Key recovery indicators include bulls holding onto the $2 support, the RSI moving above 50, and the MACD sending a buy signal as histograms turn green. XRP’s upside targets are $2.50 and $3.00 in the mid-term and long-term, respectively.
Author

John Isige
FXStreet
John Isige is a seasoned cryptocurrency journalist and markets analyst committed to delivering high-quality, actionable insights tailored to traders, investors, and crypto enthusiasts. He enjoys deep dives into emerging Web3 tren



