Binance Coin price is set for a rally after retesting the support level
- Binance Coin finds support around the previously broken descending trendline, eyeing a rally ahead.
- On-chain data paints a bullish picture, as BNB's OI-Weighted Funding Rate is positive, and the long-to-short ratio is above one.
- A daily candlestick close below $468.70 would invalidate the bullish thesis.

Binance Coin (BNB) retests its previously broken trendline on Sunday and rose 2.73% on Monday. When writing on the Asian trading session on Tuesday, it continues to trade higher. On-chain data supports BNB's bullish price action, as the long-to-short ratio is above one, and its funding rate is positive.
Binance Coin price is poised for an upswing after throwback support holds
Binance Coin price retested and found support on Sunday from the previously broken descending trendline (drawn by connecting multiple high levels from June 6). The next day, it rose 2.73%. As of Tuesday, it continues to trade higher by 1.5% at $534.70.
If this support level around $499.20 holds, BNB could rally 13% to retest its August 23 high of $599.60.
The Relative Strength Index (RSI) and the Awesome Oscillator (AO) on the daily chart are about to flip over their neutral levels of 50 and zero, respectively. If bulls are indeed returning, then both momentum indicators must maintain their positions above their respective neutral levels. Such a development would add a tailwind to the recovery rally.
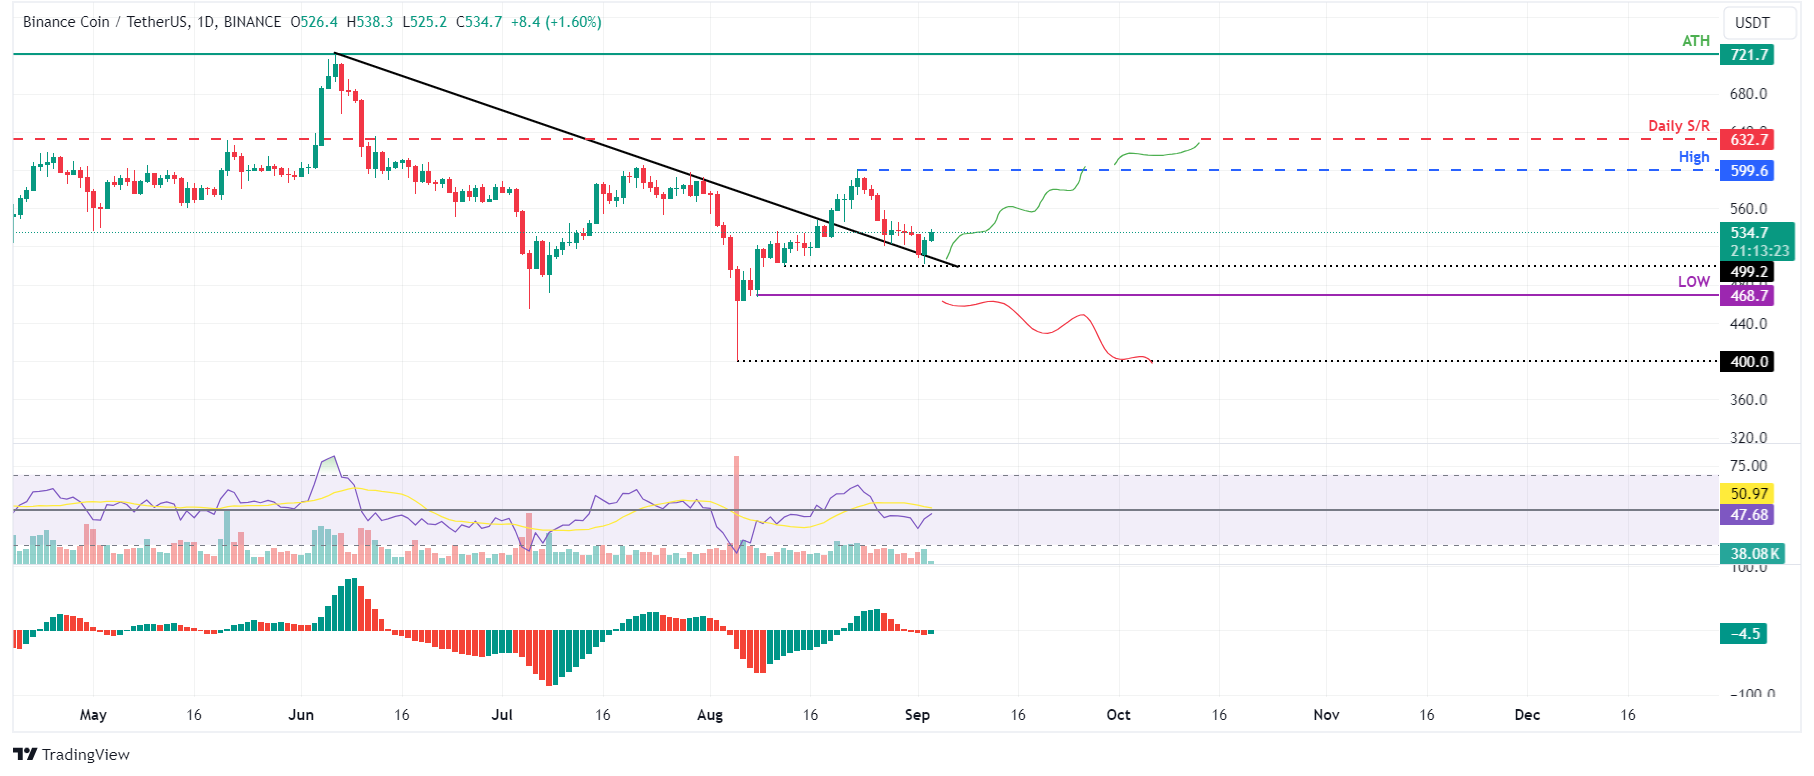
BNB/USDT daily chart
Coinglass's OI-Weighted Funding Rate data is an important metric for traders and analysts to measure market sentiment and predict future price movements. This index is based on the yields of futures contracts, which are weighted by their open interest rates. Generally, a positive rate (longs pay shorts) indicates bullish sentiment when long positions pay for shorts. Conversely, negative numbers (shorts pay longs) indicate bearishness, and shorts pay at the expense of longs.
In BNB's case, the metric stands at 0.0023%, reflecting a positive rate, indicating longs pay shorts. This scenario often signifies bullish sentiment in the market, suggesting potential upward movement on Binance Coin's price.
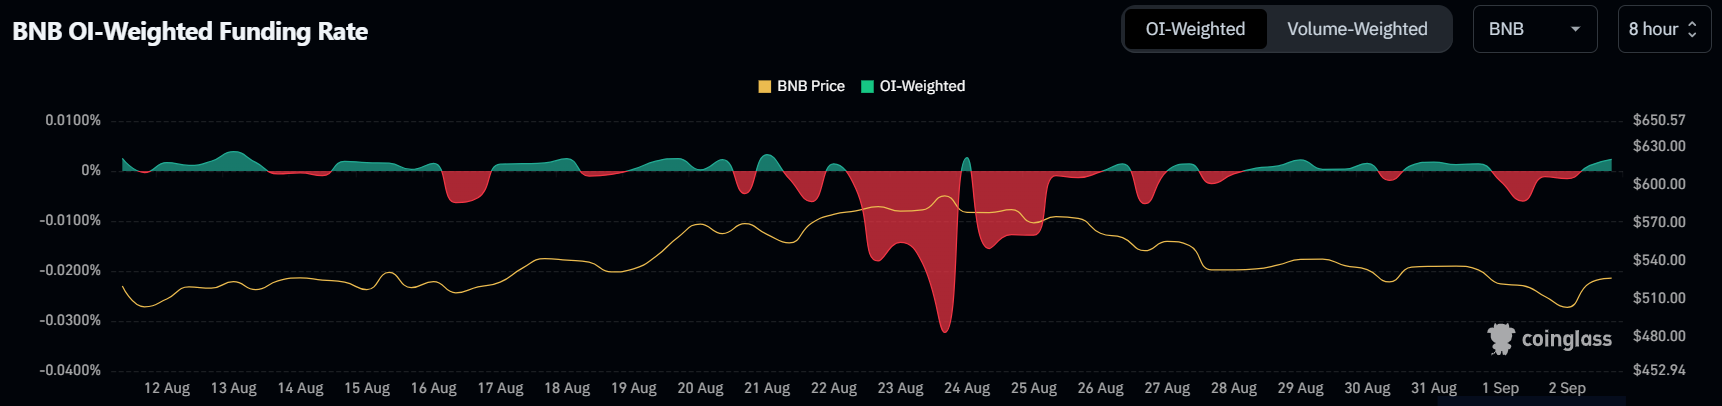
BNB OI-Weighted Funding Rate chart
Coinglass's BNB long-to-short ratio also stands at 1.31, supporting the bullish outlook. This ratio reflects bullish sentiment in the market, as the number above one suggests that more traders anticipate the price of the asset to rise.
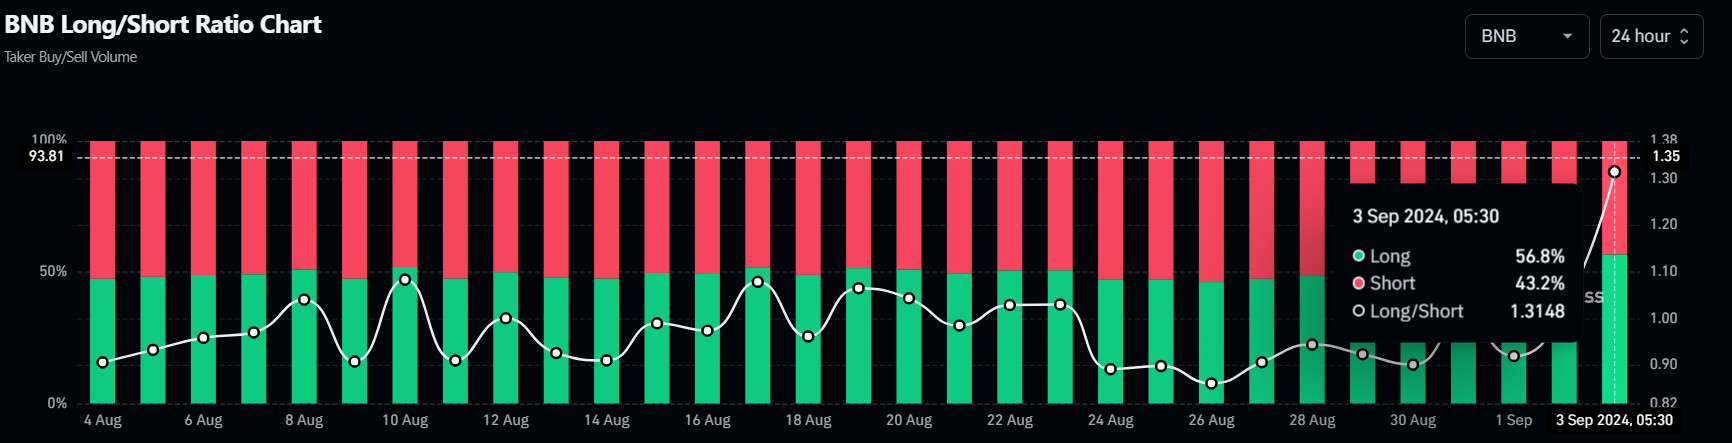
BNB long-to-short ratio chart
Even though on-chain metrics and technical analysis support the bullish outlook, if Binance Coin makes a daily candlestick close below $468.70, the bullish thesis would be invalidated by creating a lower low on the daily chart. This development could see BNB decline by 14% to retest its August 5 low of $400.
Author

Manish Chhetri
FXStreet
Manish Chhetri is a crypto specialist with over four years of experience in the cryptocurrency industry.




