Top 3 Price Prediction Bitcoin, Ethereum, Ripple: Bitcoin breaks below $58,800 support level
- Bitcoin price closes below the $58,783 support level, suggesting a continuation of the downward trend.
- Ethereum price finds resistance around its trendline pullback, eyeing a decline ahead.
- Ripple price closes below the 200-day EMA at $0.552, signaling a bearish move on the horizon.

Bitcoin (BTC) and Ripple (XRP) prices close below their key support level, suggesting a decline on the horizon. Moreover, Ethereum's (ETH) price was rejected around its resistance level, signaling a continuation of its downward trend.
Bitcoin price is poised for a downward trend as it breaks below its support level
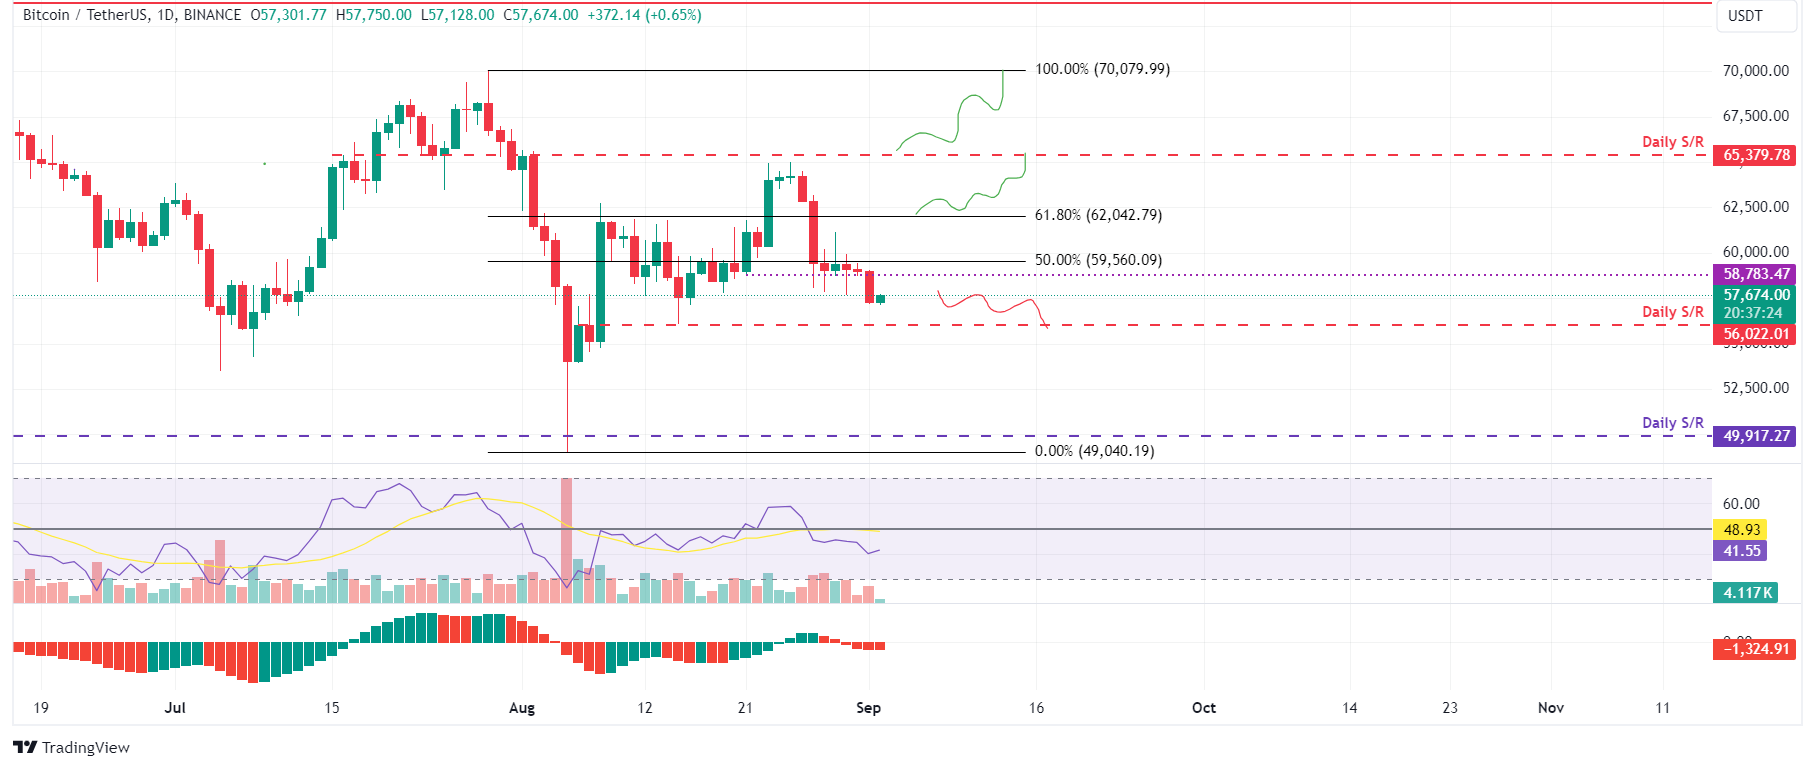
Bitcoin price closed below the $58,783 support level on Sunday and made a low of $57,201. On Monday, it trades slightly higher by 0.56% at $57,674.
If the $59,560 level, its 50% price retracement level, holds as resistance, it could continue to decline to retest its daily support level at $56,000.
The Relative Strength Index (RSI) and the Awesome Oscillator (AO) on the daily chart trade below their neutral levels of 50 and zero, respectively. Both indicators suggest weak momentum and a continuation of its downward trend.
BTC/USDT daily chart
However, Bitcoin's price breaks above the $59,560 level support and closes above $62,042, its 61.8% Fibonacci retracement level (drawn from a high in late July to a low in early August). In that case, the bearish thesis will be invalidated. BTC could rise by 5.5% to revisit its daily resistance level at $65,379.
Ethereum price is set for a downturn after retesting its resistance barrier
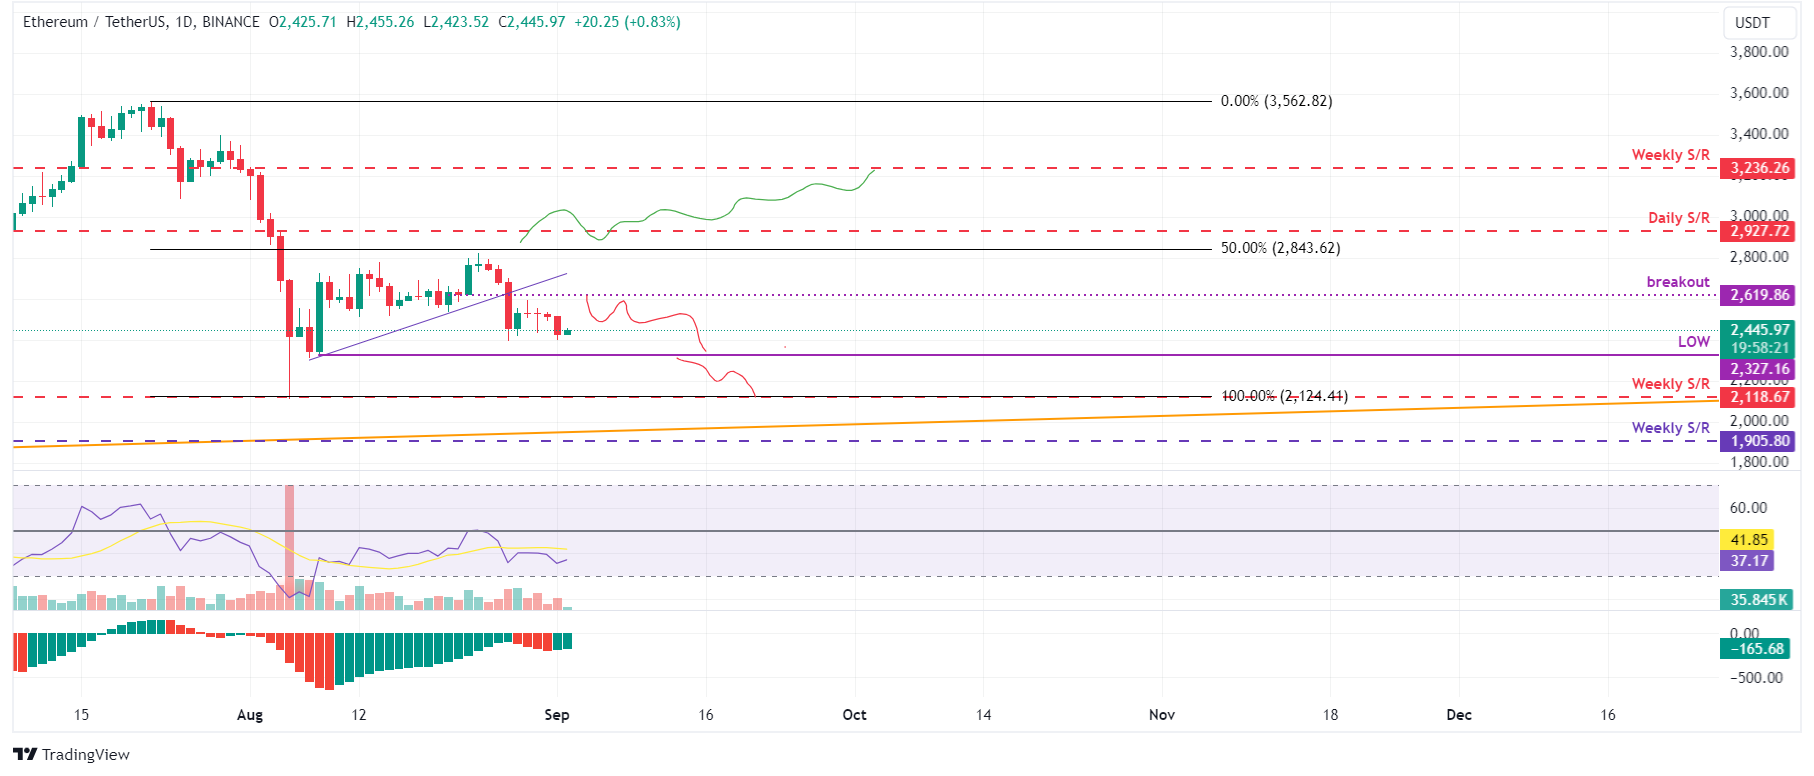
Ethereum price retested its broken ascending trendline (formed by connecting multiple low levels from August 7) around $2,619 on August 29 and declined by 4% in the next three days. On Monday, it trades slightly higher by 1% at $2,445.
If the previously broken ascending trendline at $2,619 continues to act as resistance, ETH could continue to decline by 5% to retest its August 8 low of $2,327.
The daily chart's RSI and AO are trading below the neutral levels of 50 and zero. These momentum indicators strongly indicate bearish dominance.
ETH/USDT daily chart
If ETH breaks above the $2,619 level and closes above the daily resistance at $2,927, forming a higher high on the daily chart, this would invalidate the bearish thesis, and it could rally 11% to retest its weekly resistance level at $3,236.
Ripple price is set for a fall as it closes below its 200-day EMA
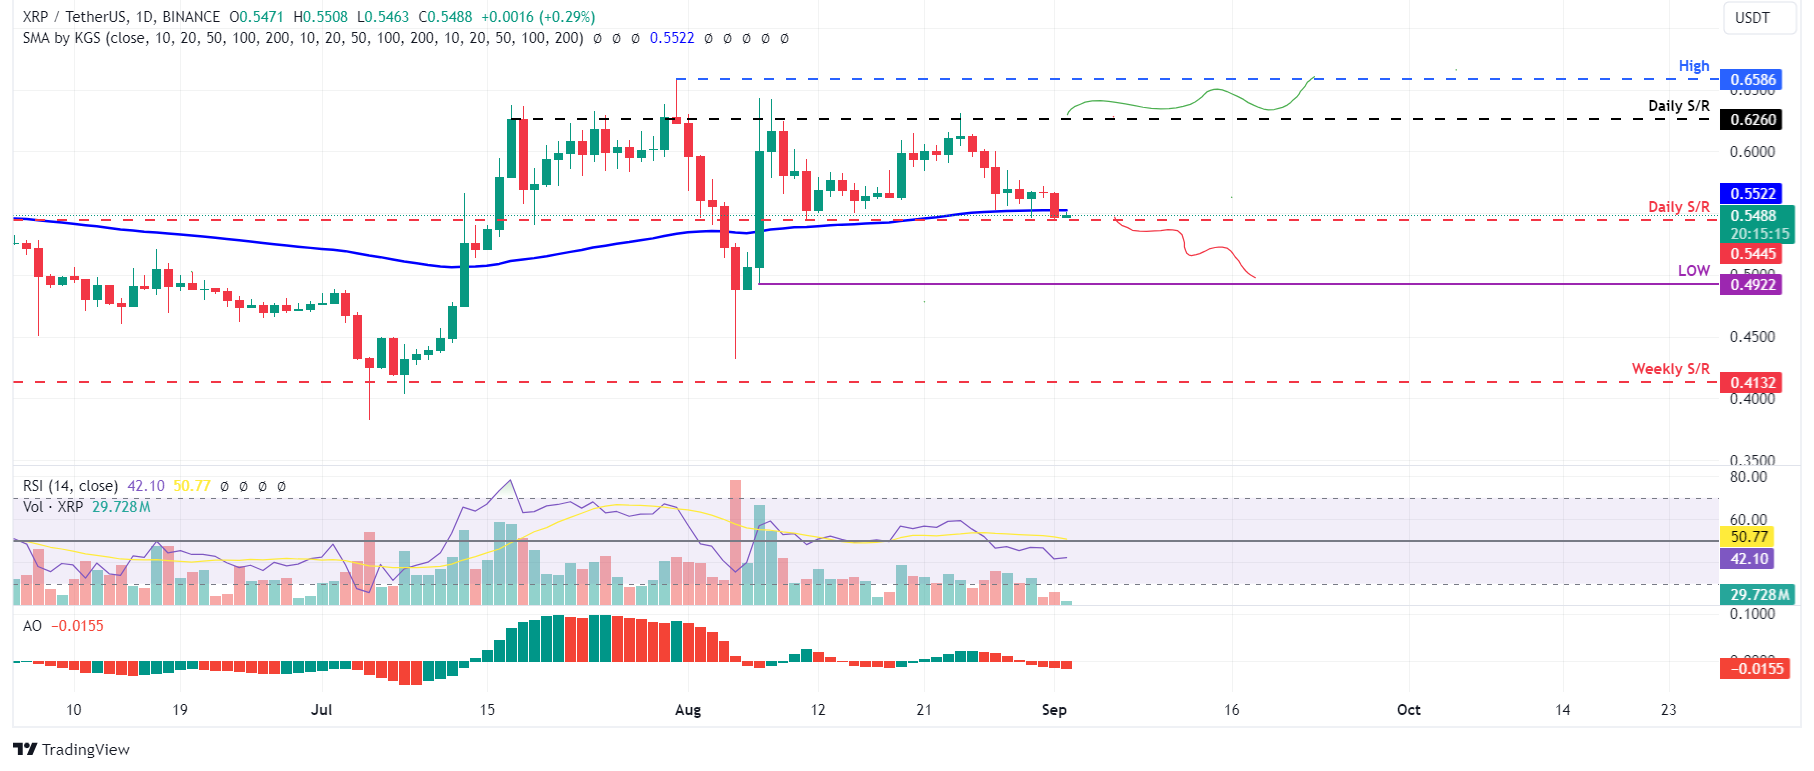
Ripple price closed below the 200-day Exponential Moving Average (EMA) at $0.552 on Sunday. As of Monday, it trades 0.4% higher to $0.564, facing resistance from the 200-day EMA.
If the 200-day EMA continues to hold as resistance and closes below $0.544, its daily support level XRP could decline by 10% to retest its August 7 low of $0.492.
The RSI and AO are trading below the neutral levels of 50 and zero on the daily chart. These momentum indicators signal a continuation of the bearish dominance and impending fall in prices on the horizon.
XRP/USDT daily chart
On the other hand, if the Ripple price closes above the $0.626 daily resistance level, it would shift the market structure by creating a higher high on the daily chart, potentially leading to a 5.3% rise to revisit the July 31 high of $0.658.
Cryptocurrency metrics FAQs
The developer or creator of each cryptocurrency decides on the total number of tokens that can be minted or issued. Only a certain number of these assets can be minted by mining, staking or other mechanisms. This is defined by the algorithm of the underlying blockchain technology. Since its inception, a total of 19,445,656 BTCs have been mined, which is the circulating supply of Bitcoin. On the other hand, circulating supply can also be decreased via actions such as burning tokens, or mistakenly sending assets to addresses of other incompatible blockchains.
Market capitalization is the result of multiplying the circulating supply of a certain asset by the asset’s current market value. For Bitcoin, the market capitalization at the beginning of August 2023 is above $570 billion, which is the result of the more than 19 million BTC in circulation multiplied by the Bitcoin price around $29,600.
Trading volume refers to the total number of tokens for a specific asset that has been transacted or exchanged between buyers and sellers within set trading hours, for example, 24 hours. It is used to gauge market sentiment, this metric combines all volumes on centralized exchanges and decentralized exchanges. Increasing trading volume often denotes the demand for a certain asset as more people are buying and selling the cryptocurrency.
Funding rates are a concept designed to encourage traders to take positions and ensure perpetual contract prices match spot markets. It defines a mechanism by exchanges to ensure that future prices and index prices periodic payments regularly converge. When the funding rate is positive, the price of the perpetual contract is higher than the mark price. This means traders who are bullish and have opened long positions pay traders who are in short positions. On the other hand, a negative funding rate means perpetual prices are below the mark price, and hence traders with short positions pay traders who have opened long positions.
Author

Manish Chhetri
FXStreet
Manish Chhetri is a crypto specialist with over four years of experience in the cryptocurrency industry.



