Band Protocol Price Prediction: BAND’s recent bullish correction may lead to a 100% upswing
- Band Protocol price has broken out of a 12-hour inverse head and shoulders pattern.
- The digital asset has re-tested the previous resistance trendline and it’s ready for a massive rebound.

Band Protocol was forming an inverse head and shoulders pattern on the 12-hour chart since October 2020 and saw a breakout on January 2021. The digital asset managed to climb above $11 from the neckline resistance at $7.4 but has recently dropped to re-test this level again.
Band Protocol price could explode to $14.5 if support holds
The previous neckline resistance level at $7.4 from the inverse head and shoulders pattern is now a robust support level. After the breakout towards $11, the digital asset has plummeted to the neckline and has been able to hold it so far.
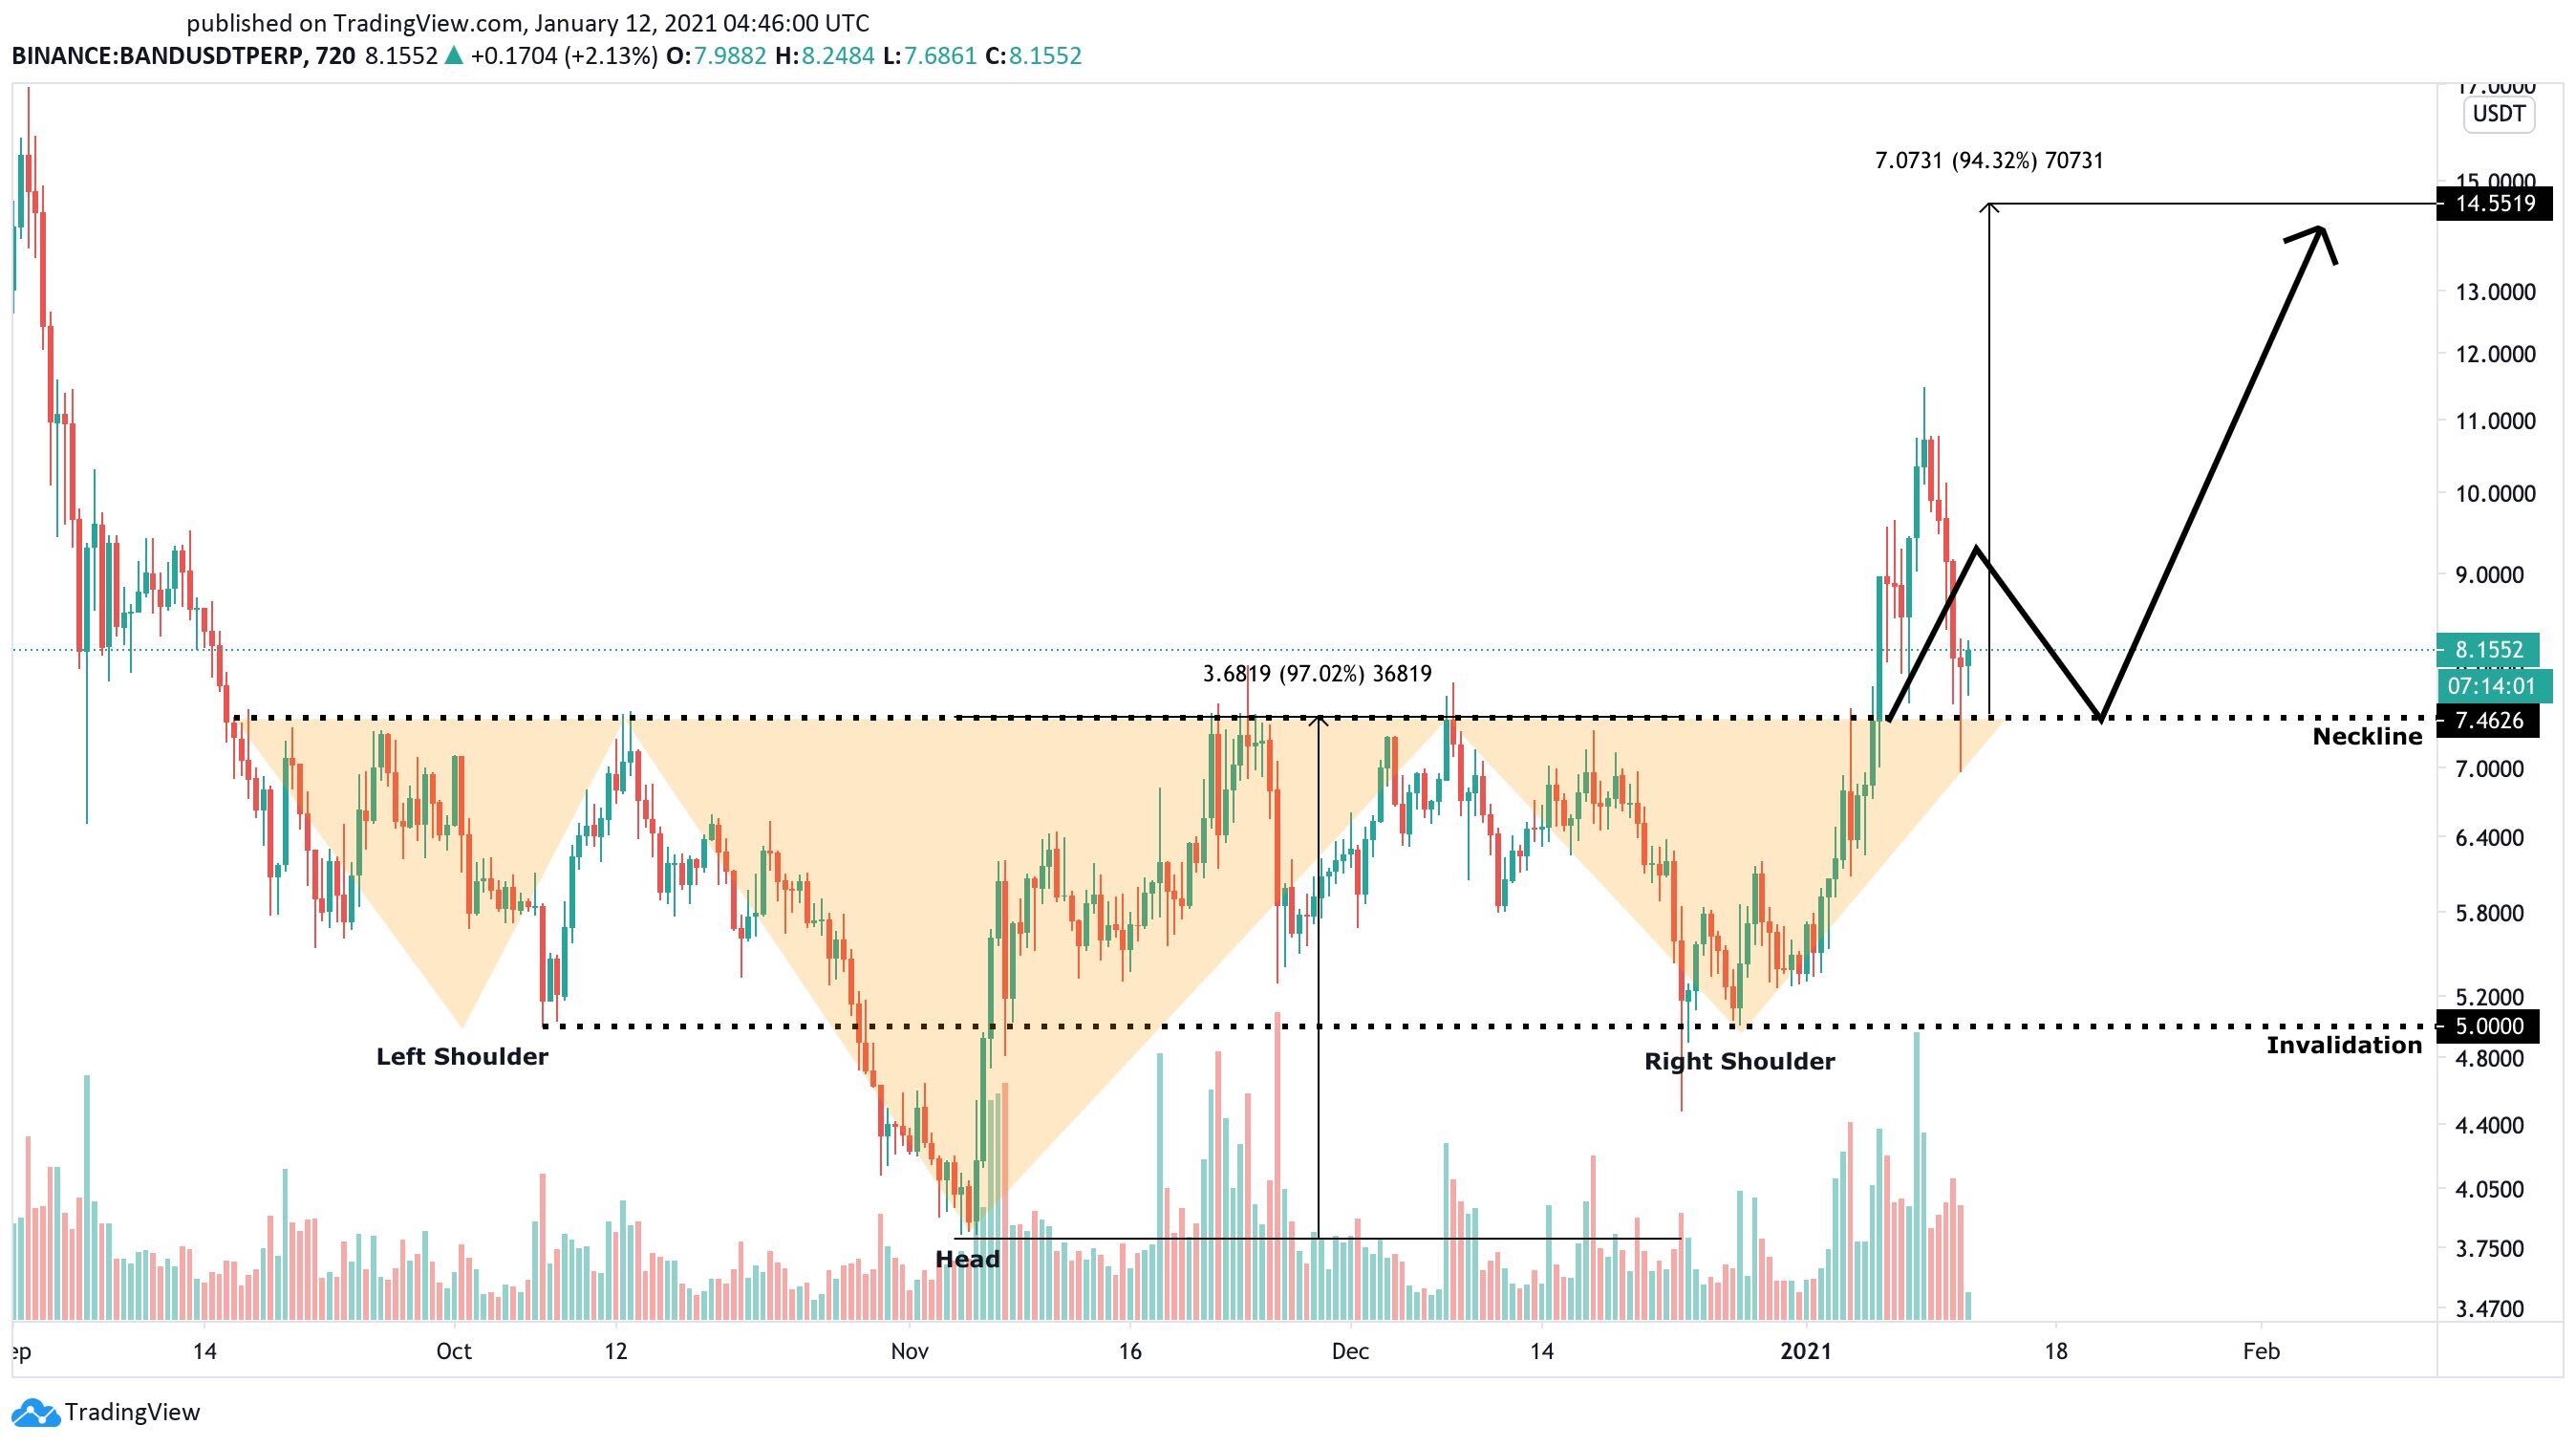
BAND/USD 12-hour chart
A successful defense of this critical support level could quickly drive Band Protocol price towards the last price target of $14.55, which is determined by using the height of the pattern from the neckline to the low end of the head.
-637460584382681438.jpg)
BAND IOMAP chart
According to the In/Out of the Money Around Price (IOMAP) chart, there is a strong support area between $7.83 and $8.06 as well as $6.85 and $7.10, giving a lot of credence to the bullish outlook and the $7.4 support level.
-637460584412213945.jpg)
BAND Age Consumed
After the significant dip from its high point of $11.45 reached on January 9 to the low of $6.98 seen on January 11, the Age Consumed metric shows a massive spike which indicates there is a good chance the digital asset will experience high volatility in the near future.
-637460584445185179.jpg)
BAND Holders Distribution chart
Additionally, it seems that BAND whales have continued to accumulate the cryptocurrency despite the price plummeting. In the past three days, the number of whales holding between 10,000 and 100,000 coins has increased by five. Similarly, whales with 100,000 to 1,000,000 coins have grown by two in the past four days.
Nonetheless, there is a chance that BAND bulls can’t hold the $7.4 level as, according to the IOMAP chart, they are also facing steep resistance between $9.04 and $9.29. Dropping below the $7.4 support level can quickly push Band Protocol price down to $6.
Author

Lorenzo Stroe
Independent Analyst
Lorenzo is an experienced Technical Analyst and Content Writer who has been working in the cryptocurrency industry since 2012. He also has a passion for trading.


