Band Protocol Price Forecast: BAND readies for a 22% downswing as network growth tumbles
- Band Protocol’s remarkable recovery from January 1 stalls under $10.
- Fewer new addresses are joining the network compared to the 2,235 on December 14.
- The IOMAP model highlights $7.82 as the most robust support area.

Band Protocol is poised to fall after an 83% upswing since the year started. The decentralized finance (DeFi) drew closer to $10 but stalled at $9.6.
This massive breakout manifested from a descending triangle pattern in conjunction with an upward boost after stepping above the 50 Simple Moving Average and the 100 SMA on the daily chart.
Band Protocol bulls seem to be running out of options
BAND is exchanging hands at $8.3 amid an intensifying bearish grip. The Relative Strength Index’s rejection from the overbought region reinforces the pessimistic outlook. If the picture remains the same, the lower leg may stretch to test the 50-day SMA.
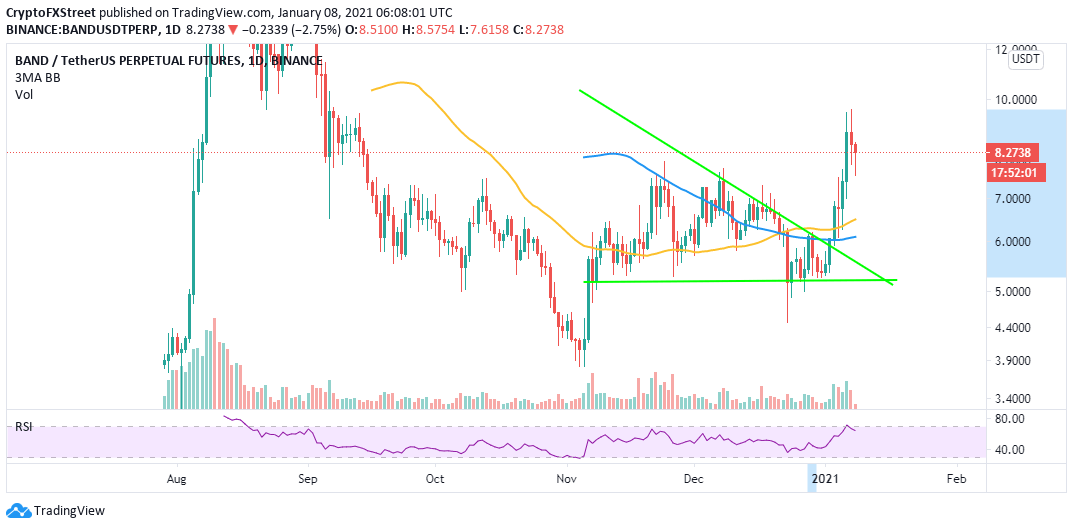
BAND/USD daily chart
According to Santiment, Band Protocol’s network growth has decreased significantly after toping 2,235 new addresses per day on December 14. At the moment, the number of newly created addresses on the protocol stands at 296, representing an 86.8% decline in less than two weeks.
Declining network growth is a massive bearish signal likely to negatively impact the token’s performance and the project’s adoption in the future. In other words, if fewer addresses are joining the network, the proper inflow and outflow of tokens on the platform is usually affected.
%20[09.47.13,%2008%20Jan,%202021]-637456852527508734.png)
Band Protocol network growth
Intriguingly, IntoTheBlock’s IOMAP model reveals a subtle resistance from $9 to $9.2. Here, 150 addresses had previously purchased 264,000 BAND. Breaking above this zone is likely to catapult Band Protocol to price levels beyond $10.
-637456853198827880.png)
Band Protocol IOMAP chart
On the flip side, the token is sitting on an area with immense buyer congestion, running from $7.7 to $7.9. Here, 147 addresses had previously bought roughly 1.2 million BAND.
Author

John Isige
FXStreet
John Isige is a seasoned cryptocurrency journalist and markets analyst committed to delivering high-quality, actionable insights tailored to traders, investors, and crypto enthusiasts. He enjoys deep dives into emerging Web3 tren


