|

Band Protocol must defend this critical support level to avoid plummeting to $4

  • Band Protocol price faces strong selling pressure as on-chain metrics turn bearish.
  • The digital asset could be poised for a massive pullback down to $4.

Band Protocol has been trading fairly sideways for the past two months despite the cryptocurrency market turning bullish. The digital asset now faces steep resistance ahead and bulls have to absolutely defend a critical support level to survive.

Band Protocol price needs to defend $5.45 to avoid slipping

On the daily chart, Band Protocol established a downtrend and dipped below the 50-SMA and the 100-SMA turning both into resistance levels. There is very little support on the way down, which means bears have a good chance of pushing Band Protocol price down to at least the last low of $4.5.

band price

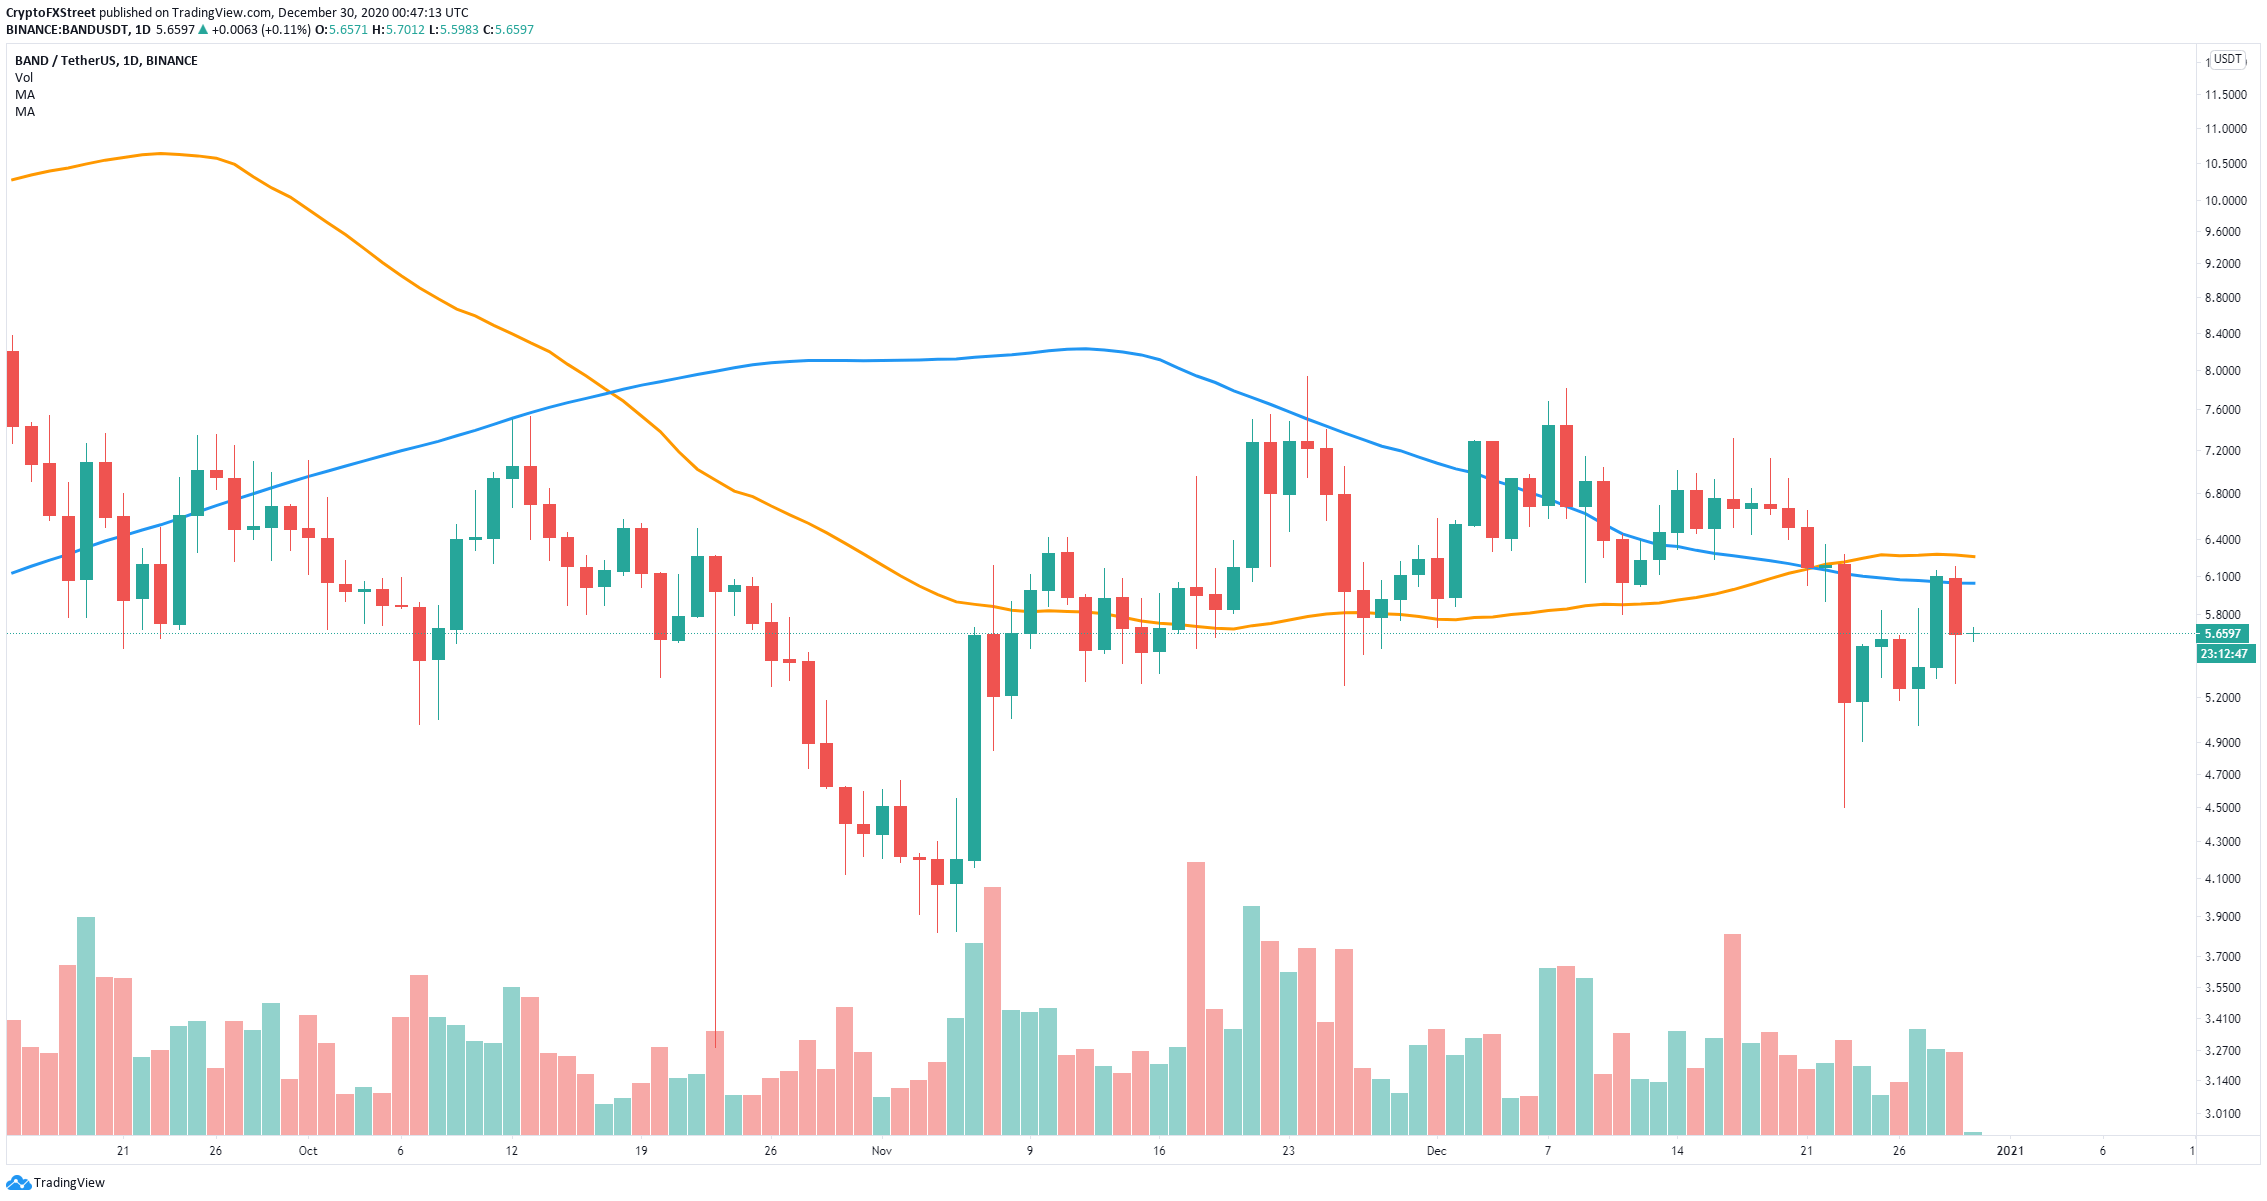
BAND/USD daily chart

The In/Out of the Money Around Price (IOMAP) shows colossal resistance above $5.73 up to $6.41. The most significant support area is located between $5.38 and $5.55, a breakdown below this range can quickly push Band Protocol down to $4.5 and as low as $4 in the long-term.
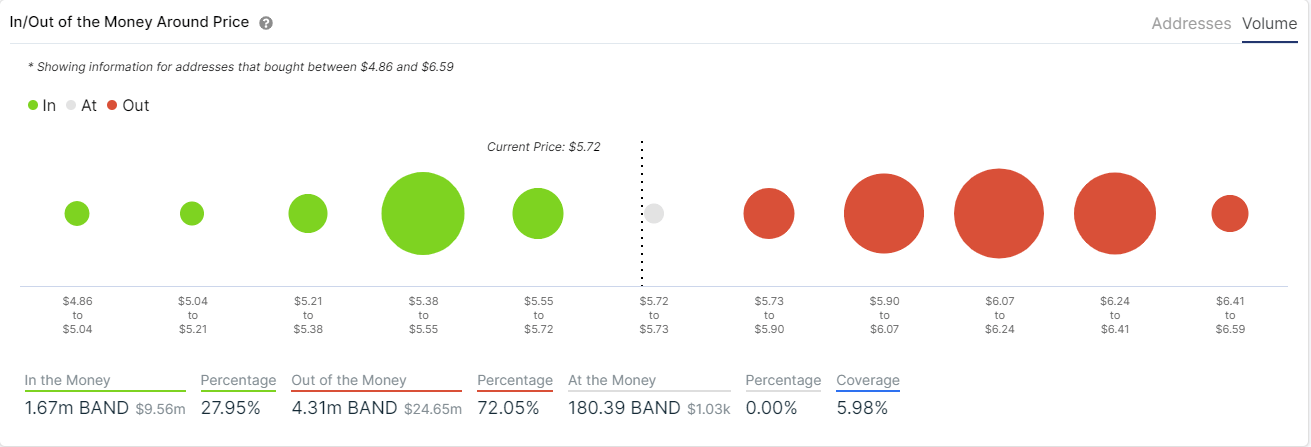
band price

BAND IOMAP chart

Additionally, it seems that the number of whales holding between 100,000 and 1,000,000 coins has dropped significantly since its peak on December 09 at 19, to a low of 14. This indicates that large holders are taking profits and exiting Band. 

band price

BAND Holders Distribution chart

The only chance for the bulls is to reconquer the 50-SMA and 100-SMA resistance points on the daily chart. A breakout above $6.3 could push Band Protocol price up to $7 as the IOMAP chart shows very little resistance from $6.3.

Author

Lorenzo Stroe

Lorenzo Stroe

Independent Analyst

Lorenzo is an experienced Technical Analyst and Content Writer who has been working in the cryptocurrency industry since 2012. He also has a passion for trading.

More from Lorenzo Stroe
Share:

Editor's Picks

Top 3 Price Prediction: Bitcoin, Ethereum, Ripple deepen sell-off as bears take control of momentum

Bitcoin, Ethereum, and Ripple continued their corrections on Friday, posting weekly losses of nearly 6%, 3%, and 5%, respectively. BTC is nearing the November lows at $80,000, while ETH slips below $2,800 amid increasing downside pressure.

Shiba Inu Price Forecast: SHIB extends losses as whale selling intensifies bearish momentum

Shiba Inu (SHIB) price slips below $0.0000077 on Thursday after correcting the previous day. Bearish sentiment is further strengthened as holders offload SHIB, increasing selling pressure and reducing Open Interest in the derivatives market.

Top Crypto Losers: Worldcoin, Chiliz, Hyperliquid lead losses as market bleeds $1.75 billion

Worldcoin , Chiliz , and Hyperliquid posted heavy losses over the last 24 hours as Bitcoin dropped below $82,000 on Friday, triggering a $1.75 billion wipeout and mirroring the bearish tremors in the US stock market.

Fidelity unveils FIDD stablecoin, set to launch in coming weeks

Fidelity Investments announced that it will launch its first stablecoin, the Fidelity Digital Dollar (FIDD), making it one of the first large traditional firms in the US to do so.

Bitcoin Price Annual Forecast: BTC holds long-term bullish structure heading into 2026

Bitcoin (BTC) is wrapping up 2025 as one of its most eventful years, defined by unprecedented institutional participation, major regulatory developments, and extreme price volatility.

Bitcoin: BTC correction deepens as Fed stance, US-Iran risks, mining disruptions weigh

Bitcoin (BTC) price extends correction, trading below $82,000 after sliding more than 5% so far this week. The bearish price action in BTC was fueled by fading institutional demand, as evidenced by spot Exchange-Traded Funds (ETFs), which recorded $978 million in inflows through Thursday.