Band Protocol Price Forecast: BAND breaks out of multi-month consolidation pattern, targeting $14
- Band Protocol price is setting up for a 90% surge due to the formation of an inverse head-and-shoulder pattern.
- The breakout from this pattern could quickly push the BAND's price closer to $15.

Band Protocol is currently trading at $8.30, right above the neckline of an inverse head-and-shoulder pattern. This breakout is essential for the digital asset as the pattern has been forming over the past 100 days.
A successful breach above the pattern's neckline at $7.60 could quickly see this altcoin double in market value.
Band Protocol price needs a bullish impulse to explode
Although Band Protocol price appears to have broken out of an inverse head-and-shoulders pattern within its 12-hour chart, it isn't out of the woods yet. There needs to be a retest of either the neckline or the immediate support at $8.20. Such pullback will allow sidelined investors to come back stronger and push BAND past the overhead resistance level at $9.50.
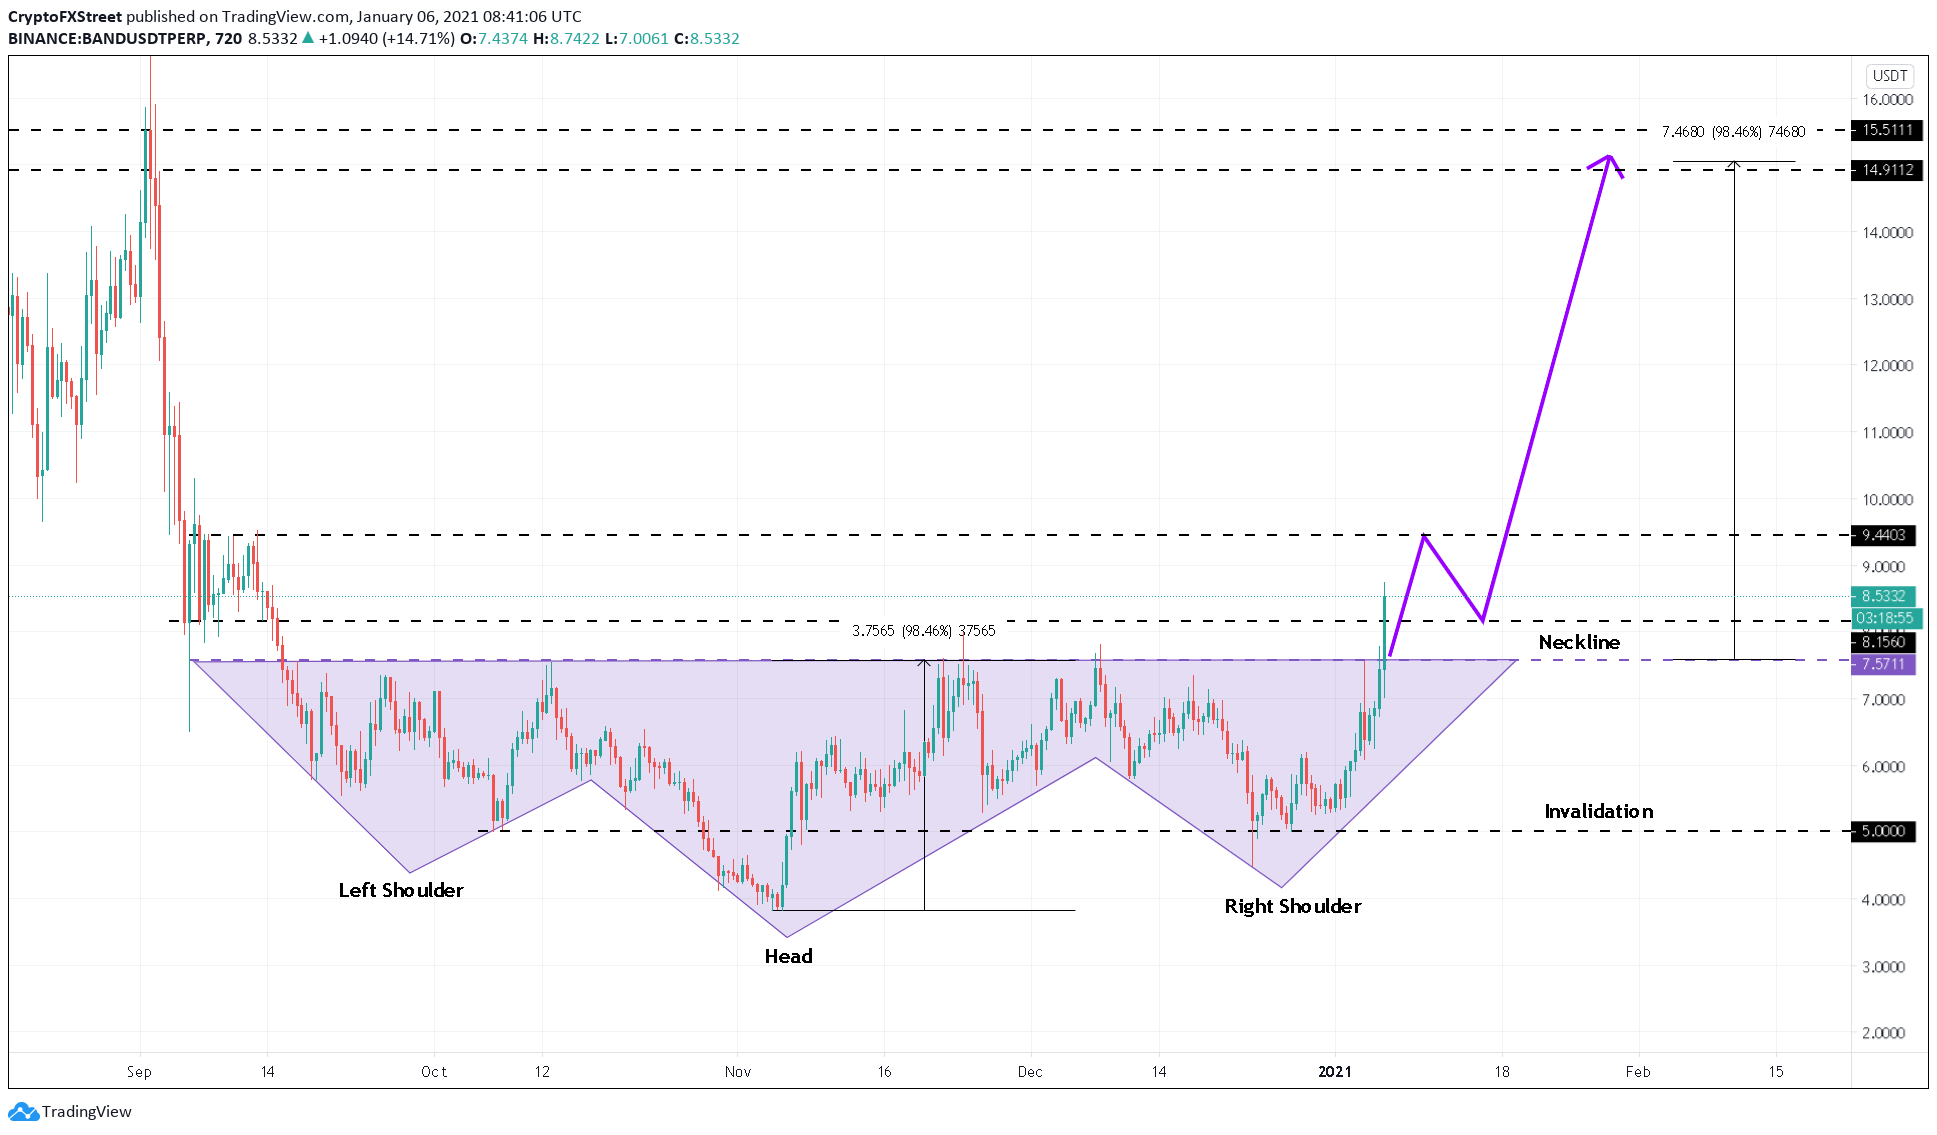
BAND/USD 12-hour chart
The pattern projects a target of nearly 99% when considering the distance from the head's bottom to the neckline. If validated, the BAND price could rise to $15.
Transaction history adds credence to an optimistic outlook
IntoTheBlock's IOMAP indicator considers the price at which an asset was purchased and compares it to the price where it trades to determine whether investors are in profit or a loss. This metric is crucial to identify potential demand or supply walls where investors are likely to add to their holdings or get rid of their bags.
At the time of writing, Band Protocol's IOMAP shows that 1.3 million BAND were bought between $7 to $7.20. Since the altcoin has cleared this level, it depicts a picture similar to the technical indicators.
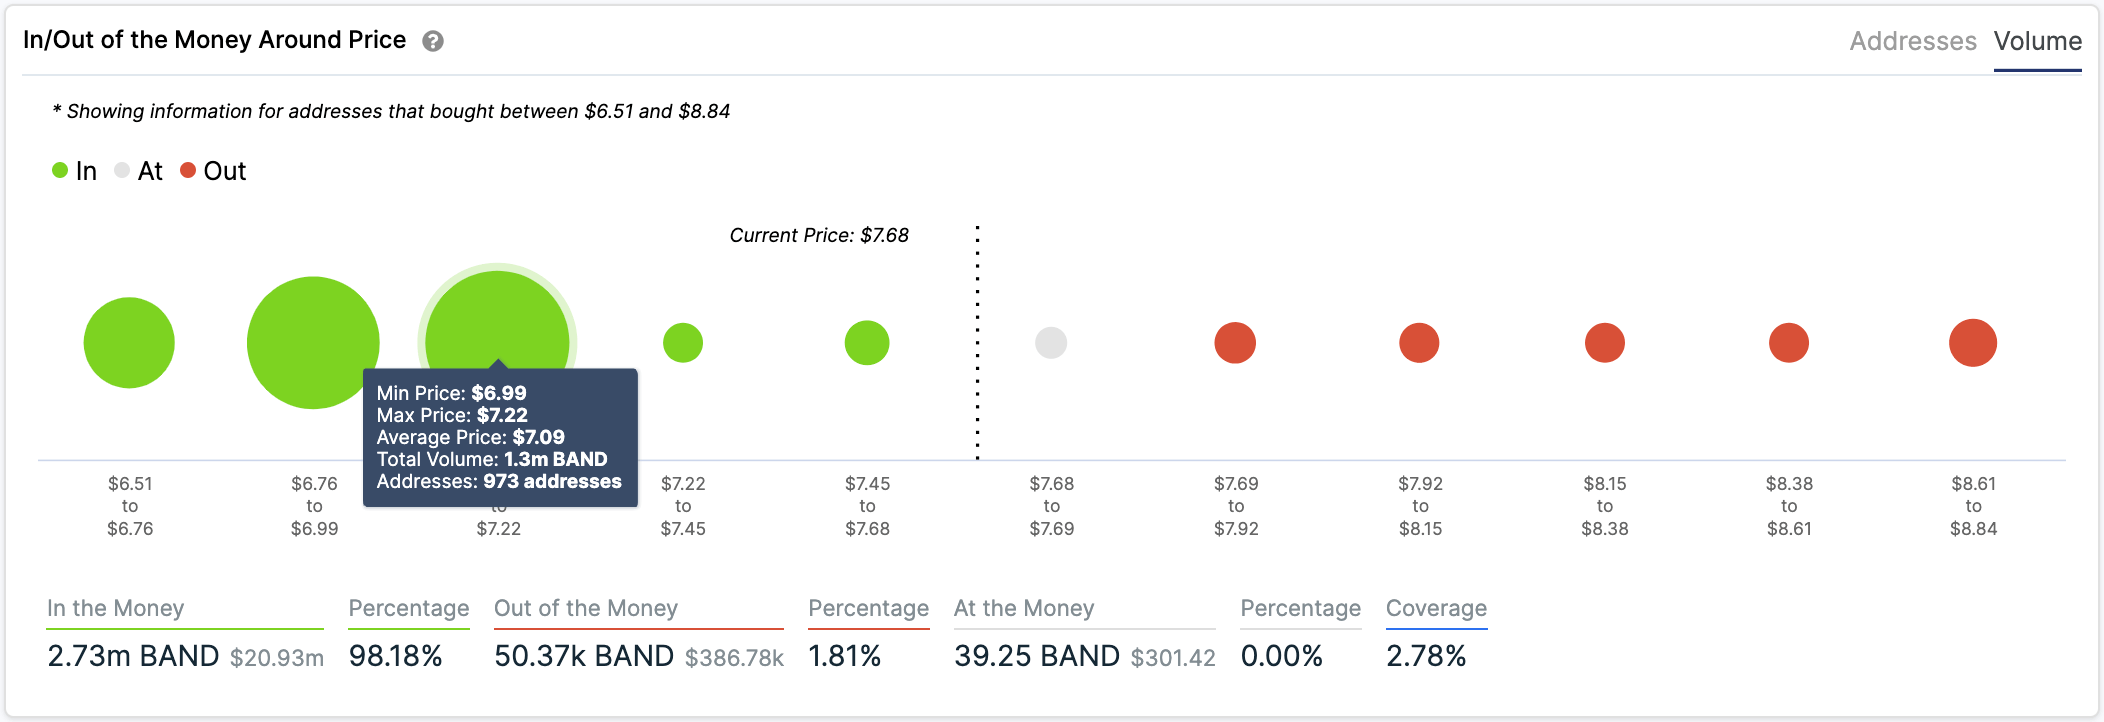
BAND IOMAP chart
Indeed, roughly 1,160 addresses have previously purchased 1.83 million BAND at an average price of $9.50. Hence, this level will be a tough one to crack. The likely course of action seems like a retracement from the overhead resistance at $9.50 towards the immediate support at $7.20 before Band Protocol price aims for the next important interest area at $13.60.
All-in-all, Band Protocol price is bullish but a minor rejection at $9.50 could push its price to $8.20 or towards the neckline at $7.60. It is worth noting that a further decline to $5 would serve as an invalidation of the inverse head-and-shoulder pattern, leading to more losses.
Author
FXStreet Team
FXStreet
Composed of a group of economic journalists and FX experts, the FXStreet content team produces and oversees all content published on FXStreet. It provides a purely journalistic approach to the Forex market.


